
![[Step by Step Guide] Map Customer Segmentation using Google Analytics and Google Sheets](/content/images/size/w2000/2020/08/1-VV34y2SUA7Qcelv6hOd9lg.gif)
 Alex Genovese
Through Google Analytics, we can analyze our customer behaviors based on their interests, commonly features through clicks, time on page, bounce rate, custom events, etc. and their behaviors as shoppers, such as add to basket, average product quantity in basket, LTV, AOV, etc.
All these information, if you setted up correctly Google Analytics, is your secret gold mine to extract your customer behaviours.
Why we should analyze customers data? Is it not only about a product selling to somebody?
Yes, it is… but it’s little bit different to “just sell”. Selling to somebody is a process that it’s generally defined with a funnel rappresentation, where each "stage" from top to bottom of it, move the customer to the sell.
The main goal of the marketing is to engage (first part of the funnel) and push down, until purchase (the bottom part of the funnel) a product or service. What to sell and how do you communicate to your customers or potentials, made the all world of the difference and for this reason you need to understand what your customers want, what they are and when it’s the best time to promote them your products (or a part of them).
What is the meaning of RFM?
RFM (recency, frequency, monetary) analysis is a marketing technique used to determine quantitatively which customers are the best ones by examining how recently a customer has purchased (recency), how often they purchase (frequency), and how much the customer spends (monetary).
“Customer segmentation is the practice of dividing a customer base into groups of individuals that are similar in specific ways relevant to marketing, such as age, gender, interests and spending habits.” from SalesForce
As you can see below, the customer segmentation clusterize your customer databases in different buyer categories, scoring them using their recency, monetary and frequency.
It’s a simple score calculation from 1–5 on the 3 different areas (RFM) which determines the customer clustering. If you want to know more you can read this article I wrote some times ago by clicking here.
The goal of the RFM analysis is to understand how many and what kind of people are actually buying on your store, based on: recency, frequenze and monetary values.
As you can see in the table below, the result of the RFM analysis is represented on these 11 clusters:
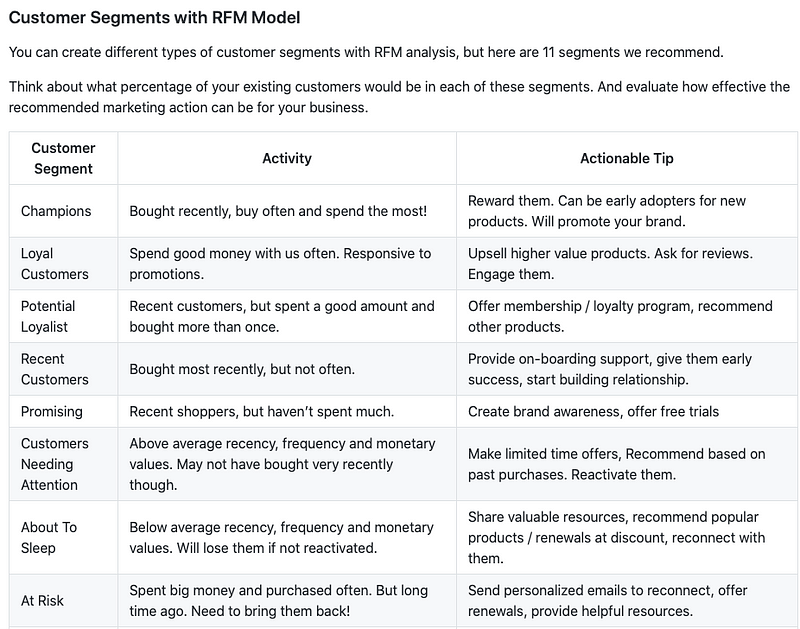
The right job of data analyst is to understand how to move, from a segment to another neighbour segment in order to propose contents and products personalized for each of them.
Let’s move on the Guide
The difference between GA and GA360 it’s only in the fact that it’s how you can query the data and the json response structure. Anyway, for the purpose of this article it’s the same.
- Create a new Google Spreadsheet, this will be our starting “database” for data acquisition from Google Analytics.
- Now install the Google Analytics add-on by clicking on Additional Components”, a modal will open where you will find, among the featured, Google Analytics. Click and install the component.
3. Now we create a new report by clicking on “Additional Components > Google Analytics > Create new report”. This will open a sidebar on the right, where you can choose an account, property, and view you want to link. Let’s go to select the following metrics:
- Users: it’ll get the GA user ID
- Transactions: it’ll show you all amounts
While on dimensions, let’s select:
- Date
- Transaction ID
Now, click on “Create Report”.
Google Analytics will create rows and columns showing all data information selected to launch the report.
Metrics: Users, Transactions
Dimensions: TransactionID, Date, Custom Dimension XX
You need to edit this the XX number: you should integrate some custom functions using Tag Manager in order to create a "User ID" variable value with customer email or your CRM internal ID.
4. At this point, we launch the report to get all the raw information.
Once the information loading is complete, it will show the data in a new tab, like the example below:
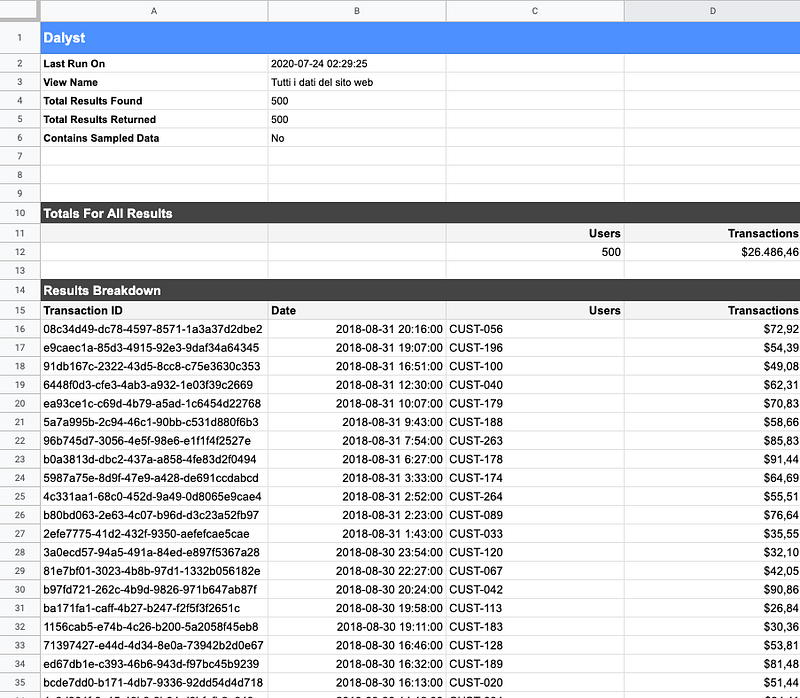
Note: the data represents the values that Google Analytics was able to track when browsing users.
In this dataset we have lines that refer to the same customer, but with different transactions. It’s all ok, now we’re going to normalize these rows.
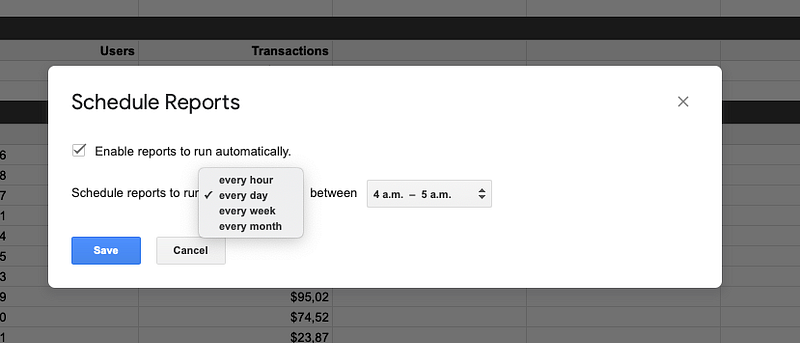
4.1 It’s possible to create a time schedule that allows you to get the dataset refresh every week or month. You can always keep track of the evolution of your customers, according to the marketing actions.
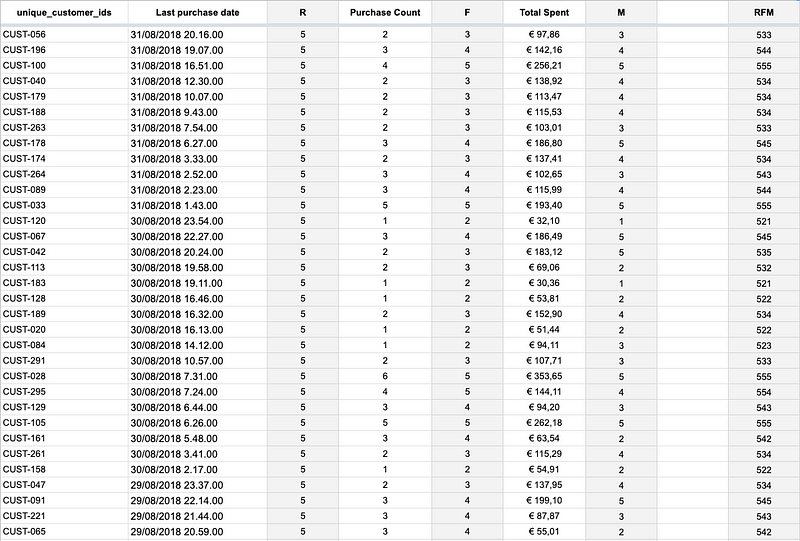
5. Now we have our starting data, we can proceed with the normalization and the calculation of the RFM matrix score, starting with creating a new tab, where we will create the following fields:
- unique_customer_id
- last_purchase_date
- R
- purchase_count
- F
- total_spent
- M
- RFM
The columns with “_” represent values that will be calculated using the functions provided by Google Spreadsheet.
unique_customer_id: Using UNIQUE, we take from the column “Dalyst!C16:C515” the IDs of customers who have only purchased once.
last_purchase_date: we take the last useful date, compared to the unique_customer_id. We need the last purchase date of our customers to calculate the Recency.
purchase_count: represents the sum of the number of purchases, compared to the customer ID in the unique_customer_id column.
total_spent: is the sum of the total purchases compared to the customers’ id.
The R, F, and M values, therefore, represent our goal to calculate our customers’ segments. In this example, given the calculation model and the tools used, we use segmentation with “Fixed values”.
Here there is the result of what you’ll get:
Now we can order and represent the RFM matrix values as we see fit, using the graphs available on Google Sheets or by linking this spreadsheet with Google Data Studio.
Download the sheet by clicking here.
– Articles Series
I published an article series based on RFM matrix to explain different applicable actionable tactics to grow your business.
In case you missed something, the series includes the following articles: