

 Alex Genovese
In another article, I defined what RFM analysis stands for, and how you can apply it to your Customer Base. I want to show you how to use it to Shopify order data.
A brief introduction to anticipate some doubts, such as:
- Why should we use RFM analysis?
- What kind of information can be obtained by using it?
- How do I increase the Conversion Rate or AOV (Average Order Value) using customer segmentation and RFM analysis?
I explain other topics in this article that you can find it useful if you have no idea about RFM analysis.
Let's export orders from Shopify
The data collected by Shopify are a pretty good starting point, but they need a little normalization to make them available for Recency, Frequency and Monetary analysis on excel.
To extract all the orders, we need to go to the backend and click on the "Orders" tab from the side menu and follow some steps described below.
- Use the "Order" and "Filter" buttons to filter all by Payment Status, Paid and Fulfilment status, and Fulfilled (you can find detailed instructions on the Shopify website).
- On the Order page, click on the Export button on the top left side.
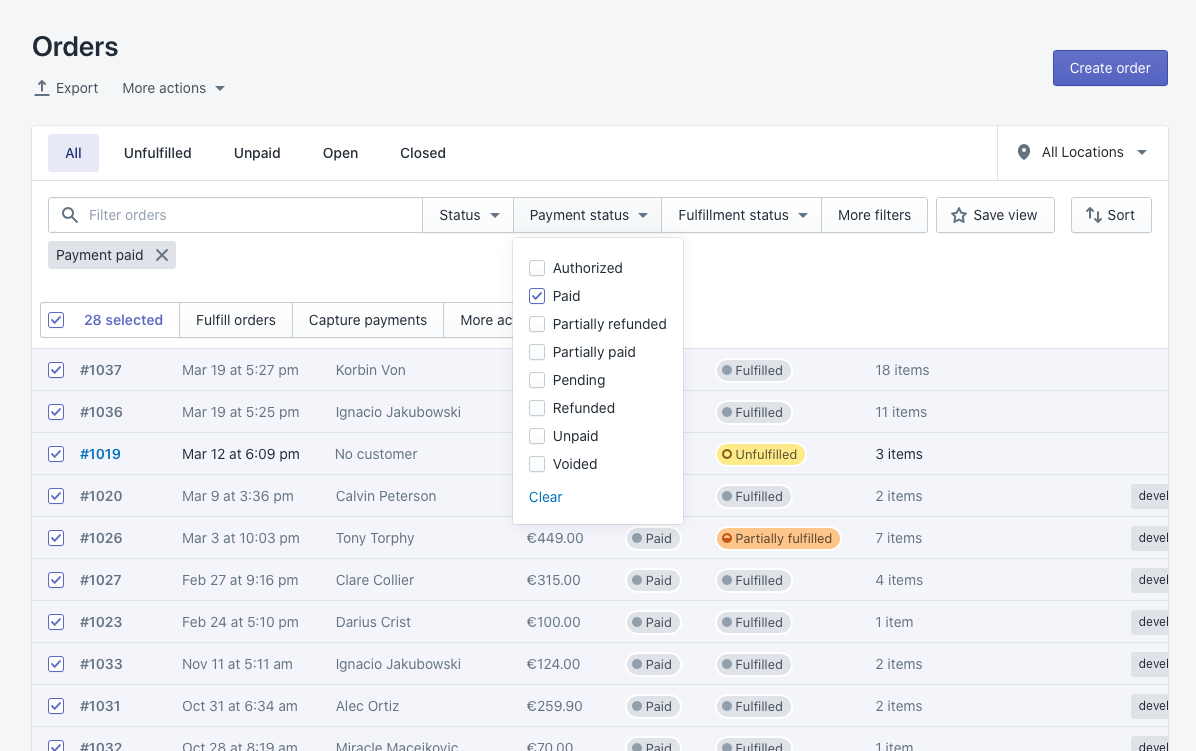
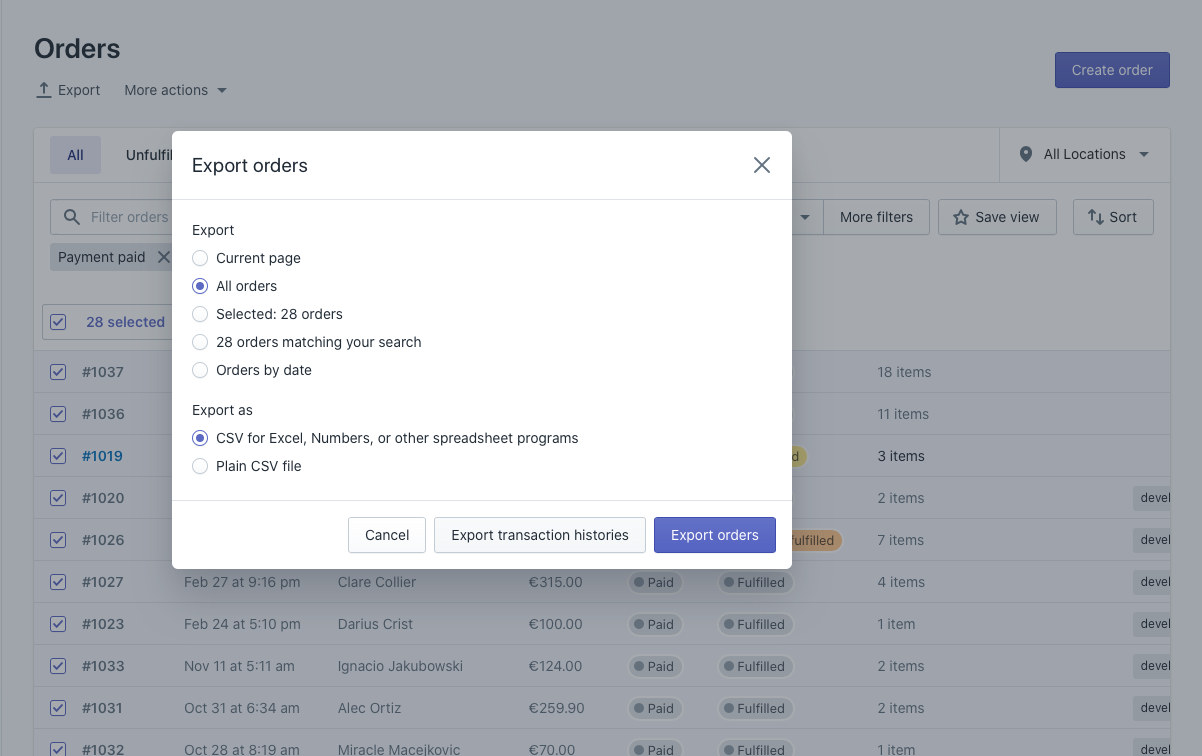
A modal window will open, showing some options.
- Select the option for All orders.
- In the Export section, leave the default selection.
Now you can click on the Export orders button to export the orders we have just filtered.
Side note
The bigger the export, the more time it takes to do it. For example, an export with less than 100,000 items could be completed in less than one hour, while an export with 400,000 items could take about 4 hours. At the end of such a long export, Shopify will notify us by email, sending us a link to download the file.
Now that we have our file, let's import it into our Google Drive account, automatically turning it into a Sheet file.
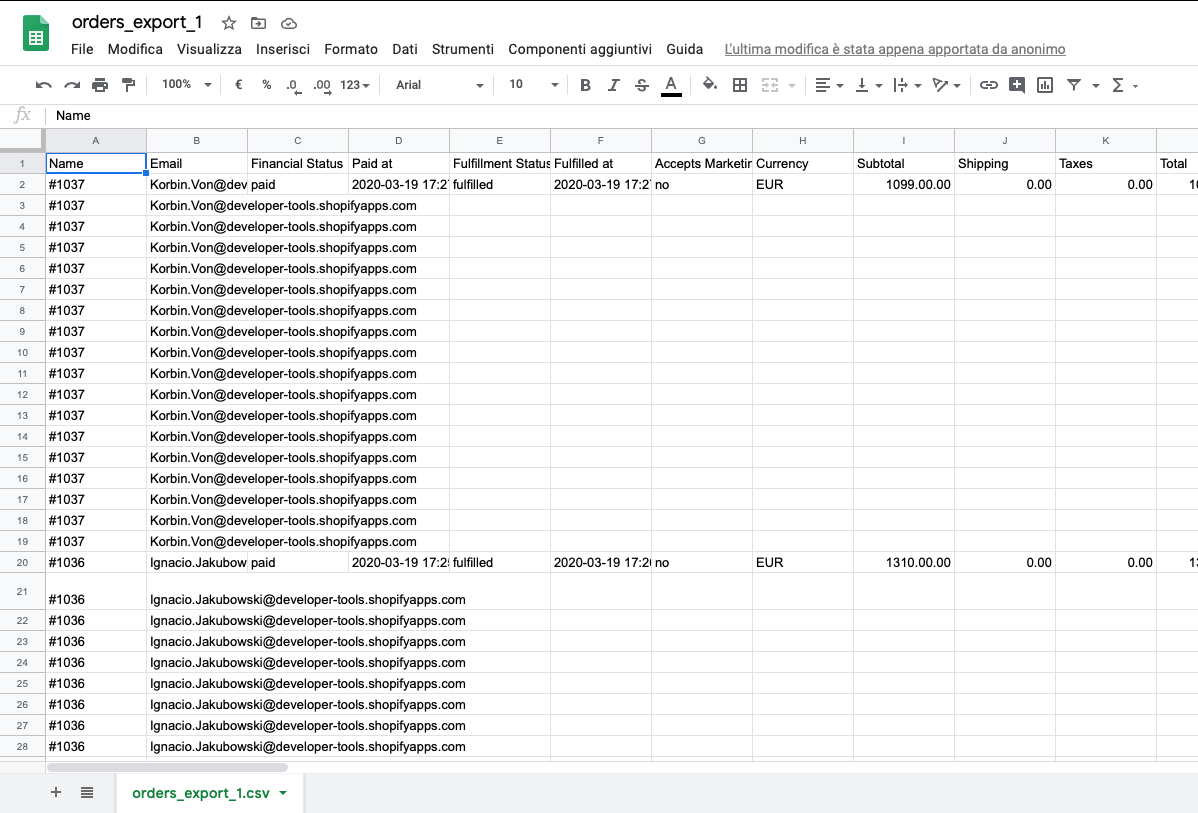
The file consists of information that Shopify keeps for our store; a lot of data is superfluous for our calculation, and we'll go forward, in the next step, to clean them.
We exported the data filtered by Financial Status, Paid and Fulfillment Status, and Fulfilled. We'll need to delete the extra columns.
First, we check that all rows are correctly filled by "paid" and "fulfilled"; otherwise, we may have inaccurate results.
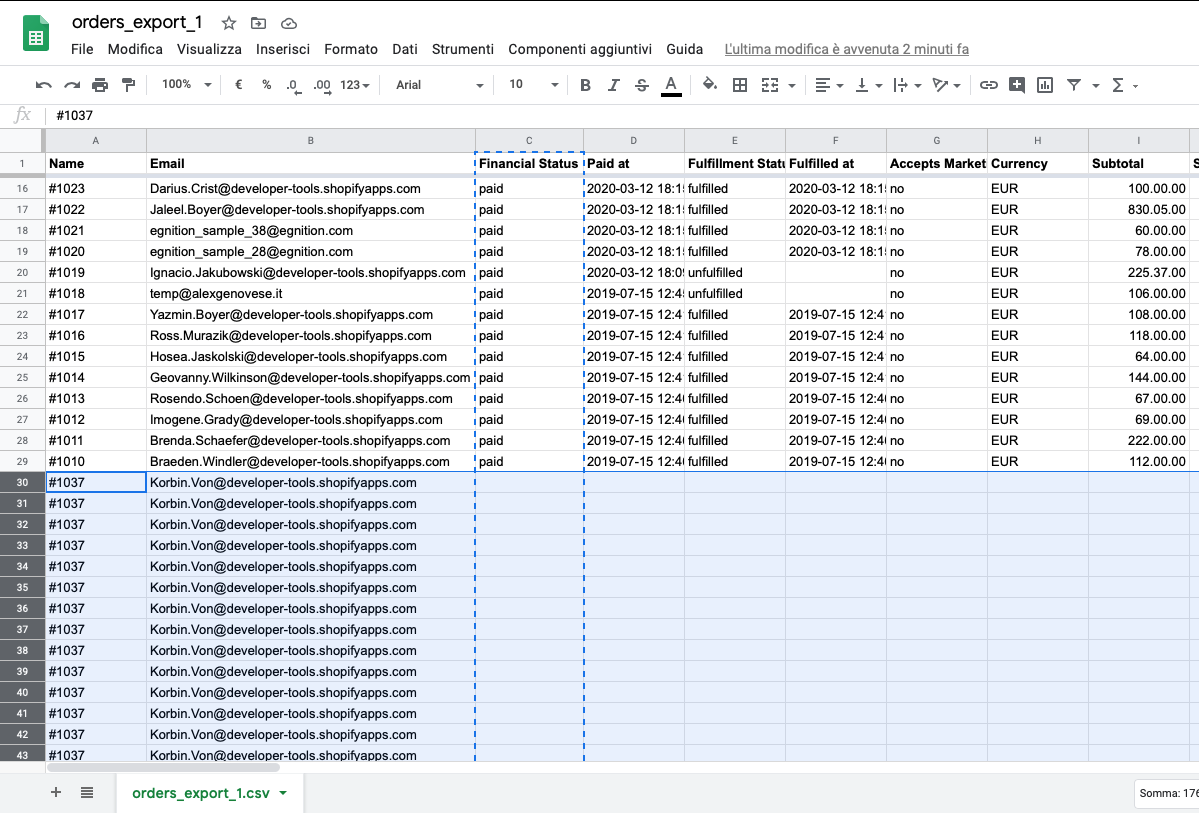
Proceed sorting from A --> Z on the column "Fulfillment Status", and delete the rows that have a value other than "fulfilled".
We delete all the columns, keeping only the fields shown in the following table and ensuring the currency field has the correct currency format.
| Field | Description |
|---|---|
| Name | Transaction ID |
| The customer's email address. | |
| Paid at | The date when the payment was captured for the order. |
| Total | The total cost of the order. |
The Email field will be our Customer ID, allowing us to display the related emails in Google Data Studio when we're going to filter on a specific customer segmentation.
TIPS - The selected segments exported can be used in Active Campaign to create targeted communications using email marketing automation.
Normalizing values
At this point, we need to normalize all values in the "Paid at" column, as the format exported by Shopify also handles the time zone. For this example, one-day variation can be allowed too, but if we wanted to apply the right conversion, we should apply a custom function in the Google Sheets scripts module in order to convert the date correctly.
Timezone conversion in a Google spreadsheet
/**
 * Converts a datetime string to a datetime string in a targe timezone.
 *
 *@param {"October 29, 2016 1:00 PM CDT"} datetimeString Date, time and timezone.
 *@param {"GMT"} timeZone Target timezone
 *@param {"YYYY-MM-dd hh:mm a z"} Datetime format
 *@customfunction
 */
function myFunction(datetimeString,timeZone,format) {
  var moment = new Date(datetimeString);
  return Utilities.formatDate(moment, timeZone, format)
}
–– Use only if you're really confident with data formatting
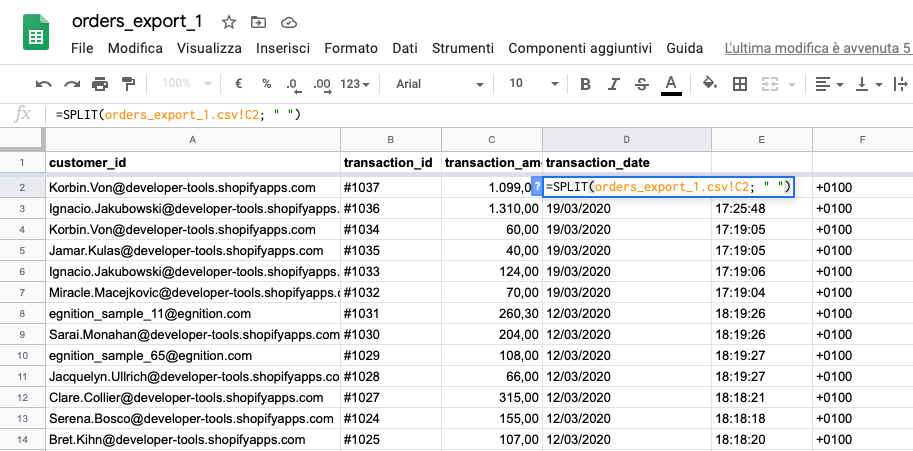
In the next step, we can apply the =SPLIT function, as shown below:
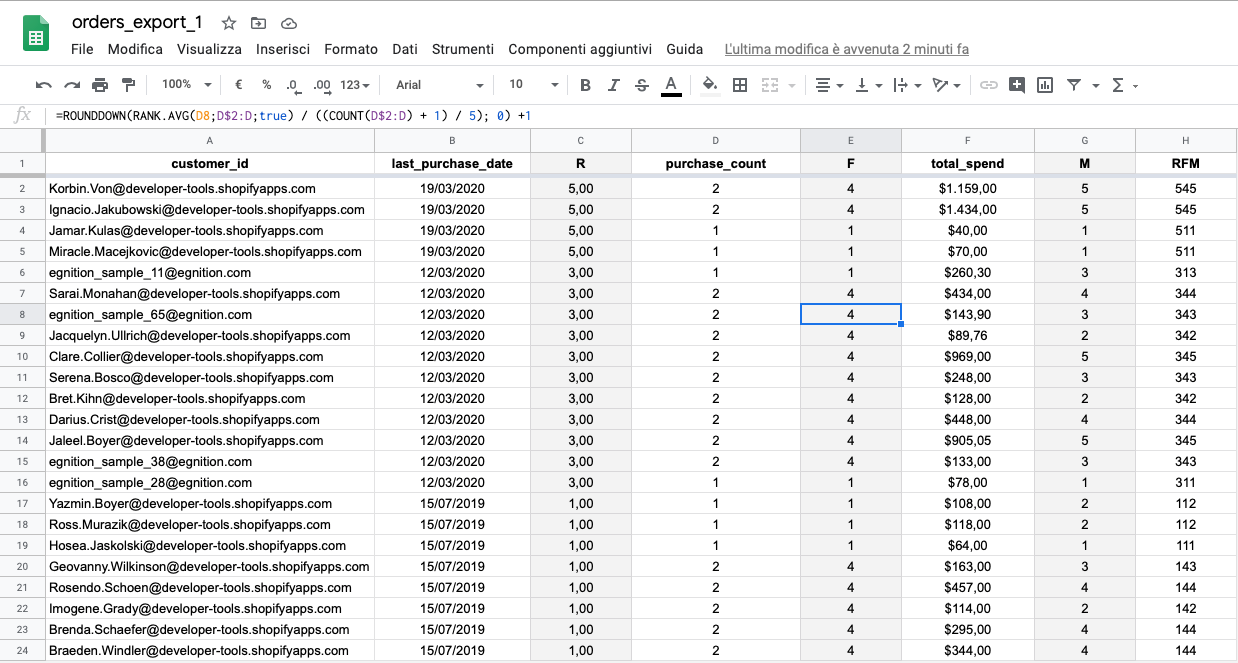
Apply the RFM matrix calculation, as shown in this article, where you can review all the single steps, or if you prefer, download the ready-made Google Sheet file.
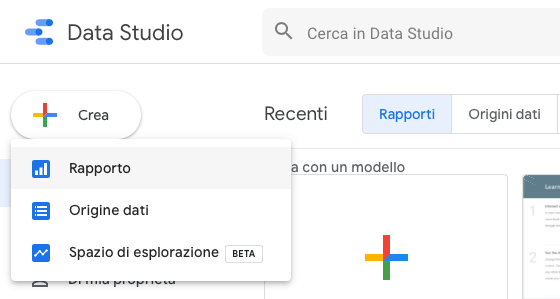
Show data in Google Data Studio
Open Google Data Studio and create a new Report, as shown below:
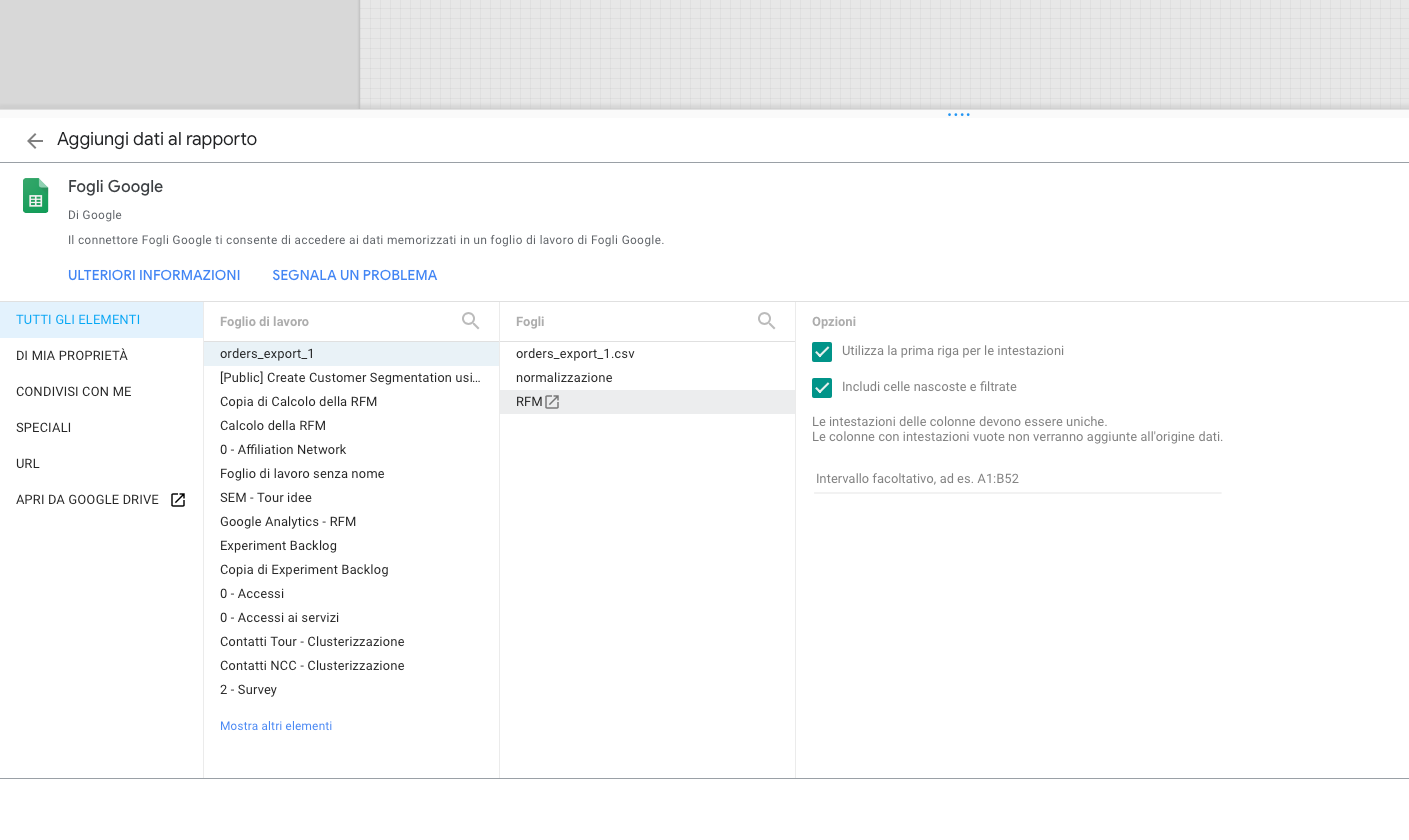
When creating a new report, you will be asked to associate a data source; select the sheet on which we have worked so far. When creating a new Report, it will be shown some different data source integrations; select the sheet on which we have worked so far.
It'll create a simple table, which we'll update as follows:
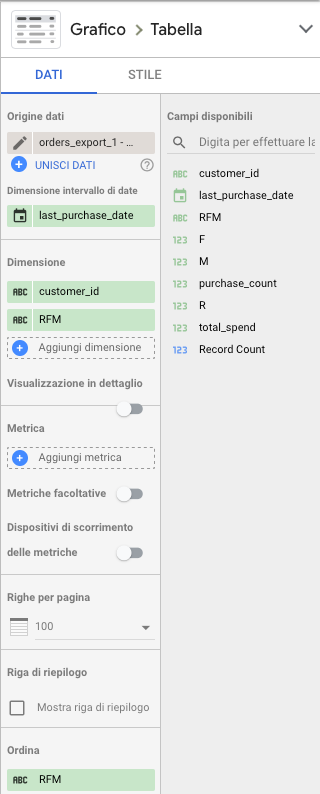
The settings will allow us to view all email and RFM values for each of our customers. Now, add a tree graph that can help us properly show how and how many clusters make up our customer database.
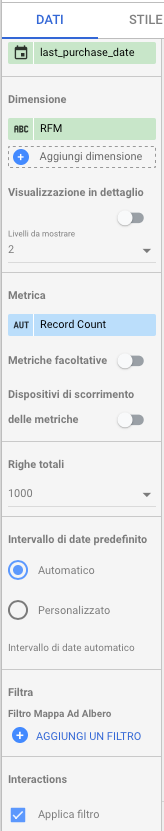
Add the "Tree Map" graph and set its configuration as follows.
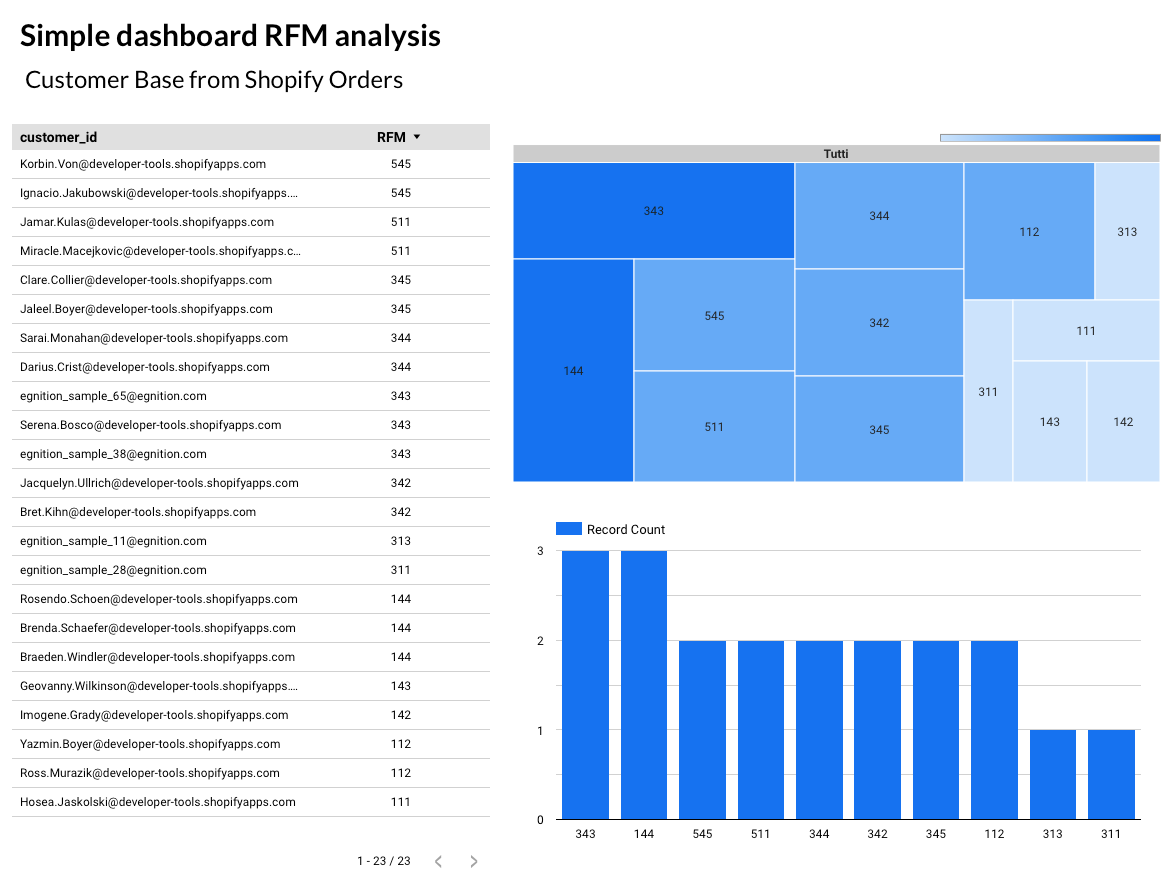
At this point, several rectangles will be shown, representing our Customer Base clustered and sorted by size: the colour becomes darker based on the sum of the emails.
The 343, 344, and 545 values represent very specific information about our customers, as you can read from the association table that I described in the final section of this article.
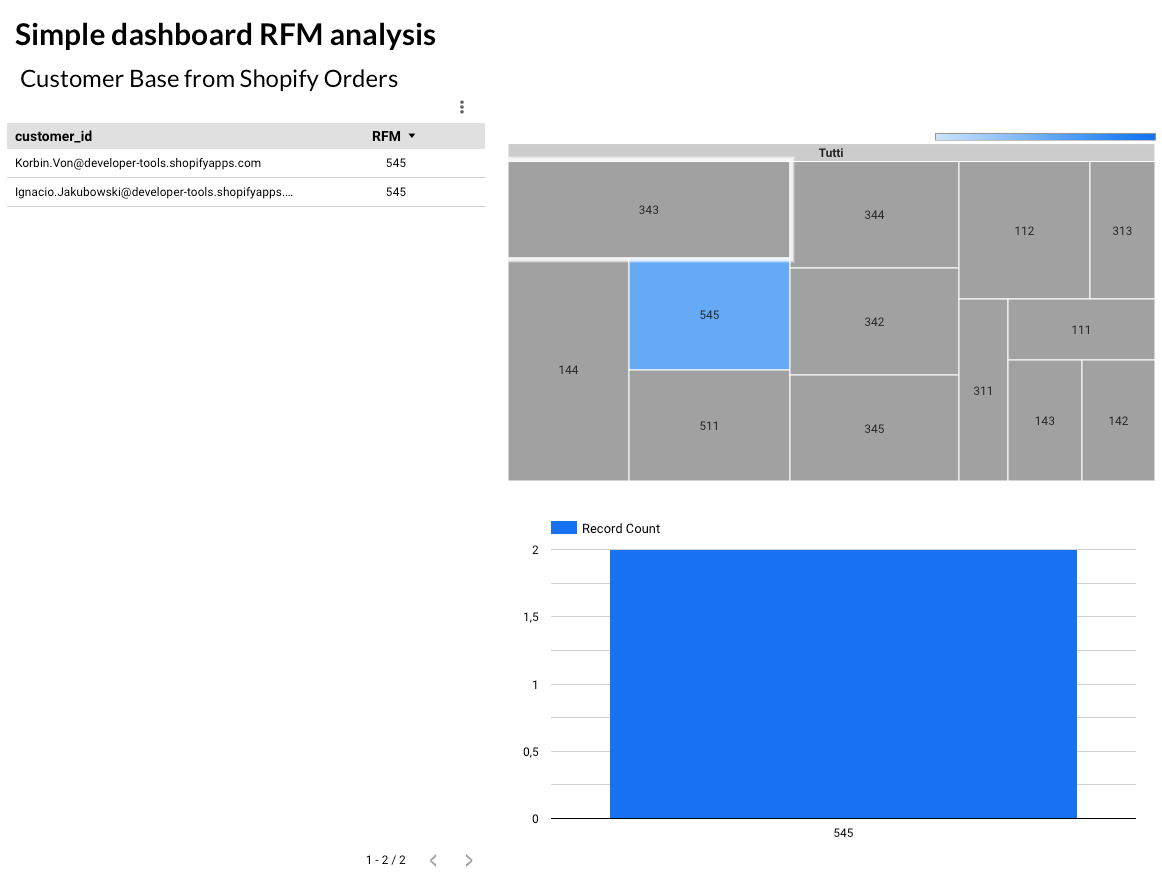
These graphs are an essential representation of our data, as you can see in the image below. Now, we can filter clicking by on these graphs, consequently updating in real-time the right side table with the related emails of the customers belonging to the clicked segment.
PRO TIP - When we normalize the orders, there were other data too that we cleaned (e.g. products number for each order, cost per product and many other data). These columns could be interesting to keep and shown in Google Data Studio, while your filtering the cluster.
In Google Data Studio, you can create a custom dashboard more suited to your specific needs.
Here, you'll find the Data Studio dashboard, which is a good starting point for building a more functional one.
– Articles Series
I published an article series based on the RFM matrix to explain applicable, actionable tactics to grow your business.
In case you missed something, the series includes the following articles: