As the retail industry is highly visual, product categorisation is one of the most critical aspects that Store Managers accomplish in sync with Brand will. This entails, often, some simple tasks such as separating a long-sleeved polo shirt from a short-sleeved one, isolating a belt worn over jeans, or knowing what in the database was technical sportswear versus athleisure, for example.
As merchandising in retail continues to evolve with data integrations and other analytical solutions, merchants need to become much more nimble and ready to fulfil customer needs.
To date, algorithms are commonly used for tracking customers' behaviours and journeys, analysing their purchase history for a better product upsell/cross-selling recommendation, they help them to find the right product during their search intent and autogenerates category or the homepage to serve the best information during their shopping experience.

An interesting article I read in Wall Street Journal and some other newspapers about using artificial intelligence and big data at H&M.
I want to focus on 3 interesting points that can actually be implemented right now, on whatever ecommerce platform:
- Customize the Visual Merchandising: they are using Big Data and AI to customize the merchandising mix of individual offline stores to reduce markdowns through store receipts, returns and loyalty-card data.
- Analyze sell-out: in Stockholm stores, H&M analyzing purchases and returns, discovered that the store’s customer base was primarily women and that fashionable items like floral skirts in pastel colours and higher-priced items sold better than the retailer expected.
- Optimize the merchandising: last year, H&M cut the number of SKUs in the store by 40%, and eliminated most menswear products.
Ok, what can I do on my ecommerce?
You can easily export your analytic and marketing data from your Google accounts to analyze your online business.
With the right proportions, even a company not as big as H&M, could deliver something similar on its ecommerce with a consequent competitive advantage.
– Customize the VM

How can I get a personalized experience to my customers about visual merchandising on the ecommerce?
To implement this feature you have 2 roads on your way:
- set it up through a developer implementations
- set it up on your own using an easy product that facilitates setting
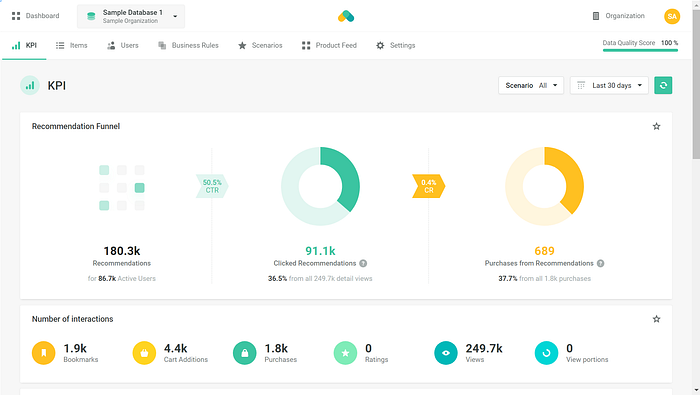
Regarding the first solution, I suggest using Recombee because it’s super simple to use it since its implemented on your platform (whatever).
You can read this simple article to implement a merchandising machine learning drive in only 10 minutes.

On the other way, you can run some “ready to use” solutions like:
- Nosto UX
- Search Spring
- Segmentify
They provide some connectors for different ecommerce platforms. Once connected, they will analyze all your history data for their recommendation system, showing the best products and information based on your different customer segmentation or purchase history, injecting the code directly in the category, product page and homepage.
– Analyze sell-out
How can I analyze correlations between my customers, products and purchase history?
To get information on the correlation between customers and purchases, one of the best solutions is to create an RFM analysis: it’s part of the predictive statistical techniques that can associate a score with your customers.
The analysis does not tell you if you are making money. Still, it’s used to classify your customers for targeting purposes and, therefore, to plan the most relevant communication possible.
Frequency: how recently did the customer purchase?
Recency: how often do they purchase?
Monetary value: how much do they spend?
Why should you need an RFM analysis?
There are many reasons for creating this analysis; here I listed 3 above all important, in my opinion:
- customers who have recently purchased are more receptive to subsequent promotions than customers whose last purchase is far in the future
- understand your customer segmentation based on monetary and frequency evaluations: VIP, loyalty, active and inactive
- Customer Lifetime Value
To achieve this information, we should go deep inside ecommerce data, aggregating and normalise the different sources and creating the RFM report. It’s not simple as it seems :)
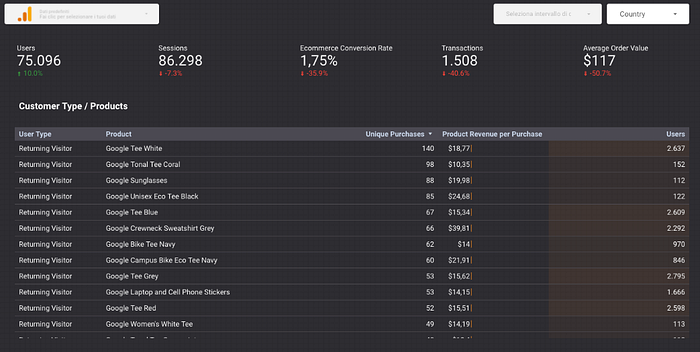
But, I’ll try to do this using only Google Analytics and Google Data studio, showing them as simply as I can in just one table:

In this article, I’ll focus on understanding how to extract these two useful pieces of information easily. In the following articles, I’ll describe how to create an RFM analysis from different sources: stay tuned and subscribe at my newsletter!
Link your Google Analytics account (check the advanced e-commerce options were active) and analyze those correlations using this dashboard:
Once you click on, you’ll see the screenshot above with sample Google Analytics data. If you want to integrate yours, you need to click the “Create a copy” button and select the source on the top left of the dashboard.
If you have created different segments and metrics regarding customers, you can edit this table and substitute the “User Type” dimension with yours.
– Optimize the catalog
How can I understand what items to cut off from my inventory?
In the same Data studio dashboard, you can see the section “Most selling products” where you can order the data to show what you need. The table is ordered to show to answer the question above.
If you want to analyze which products drive your business, you need to order the table by “Products Revenue per Purchase”.
Otherwise, if you’re interested to learn more about which products are viewed most but aren’t sold (for some reason), you have to order by “Product Detail Views” and see “Products Adds to Cart” to understand which one is the most NOT added to the cart.
If you need to set up your ecommerce with the right metrics and dimensions or some other detailed information for your business, feel free to comment and ask your point of view or questions.
