

Premise
If you would like to go deep inside on what is the Conversion Rate Optimization, you can check out this link on Moz.
I watched these interesting events, rolled up some months ago, by Google Cloud Mobile UX Marathon. Here you can find some videos that explain some tricks concerning mobile UX and CRO.
Or, if you’re a busy guy and you like to read tweets on Google Primer, it’s up to you. It’s a simple learning app, built on the card concept.
During my job routine, I'm finding the same issues in different e-commerce and I would like to explain how you can fix them in your business.
I’m pretty sure that, all these following issues are not a piece of fresh news for most of the insiders, but I would like to show a practical point of view: I’m going to calculate the profit loss that some well-known Brands potentially lose.
The top 5 common issues I see more often:
- Slow load page time (> 2.5 seconds)
- Search Bar: Bad features and not expanded bar
- Product page
- Category page
- Checkout
1. Slow load page time
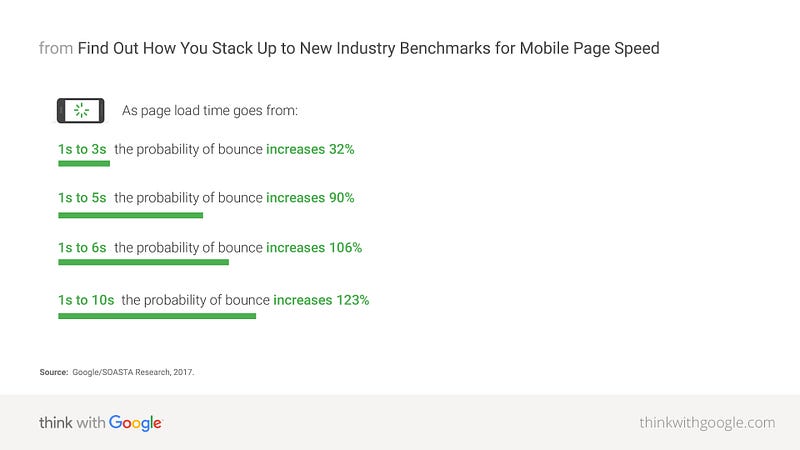
According to Forrester mobile purchases will value $175.4 billion in retail sales by 2022, that’s why you should act now fixing this issue. The insiders pay the most attention to the desktop devices, instead, the optimization for page speed load needs to be moved on the mobile one.

Industry stats — In the following metrics you’ll find some common data in the retail industry, in pills:
- Average time page load (Homepage) in Italy: 12,7 s (Source: Casaleggio);
- Average time page load (Homepage) in WW: 2,5 s (Source: Google)
The 3 top common pain points:
- Absence of Accelerated Mobile Pages (AMP): This technology insanely reduces page load time. For Example, WompMobile case study have seen an increase in conversion rates by 105% and a decrease in bounce rates by 31%;
- Absence of Progressive Web Applications (PWA): Convert eCommerce/websites into mobile apps, without coding an actual application and it’s accessible from the home screen with app-like experience. For Example, Lancome case study have seen a 17% increase in conversions, a 53% increase in mobile sessions due to app-like experience and 12% increase in recovered carts with the help of push notifications;
- Mobile-Friendly (not considering that there’s no “mobile-first” thinking for the most).
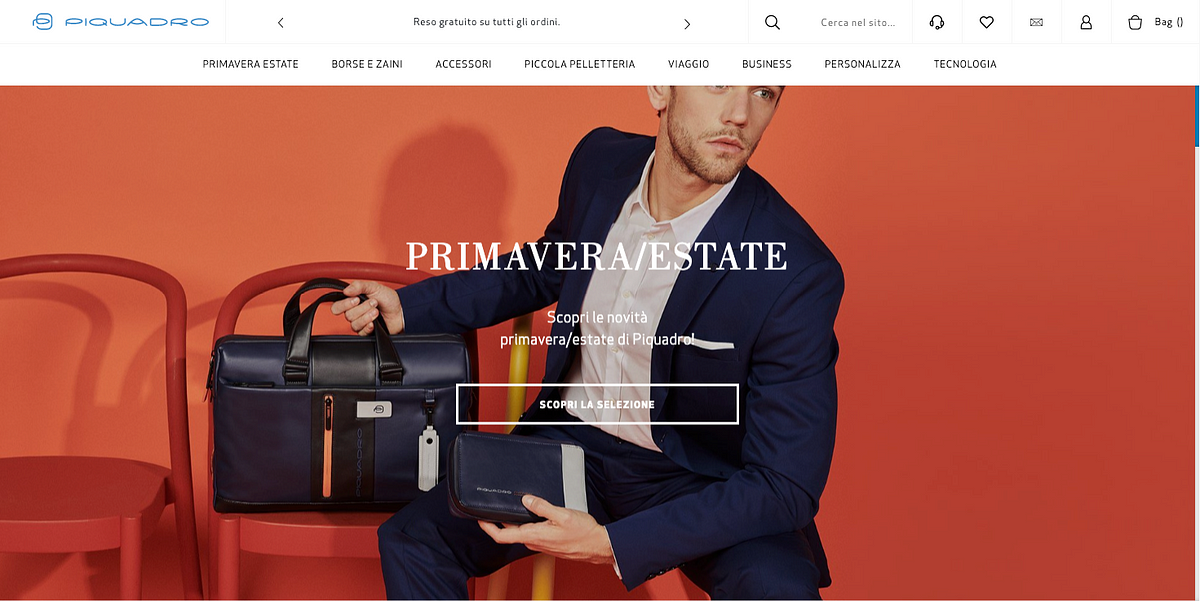
1.1 Case Study: Piquadro
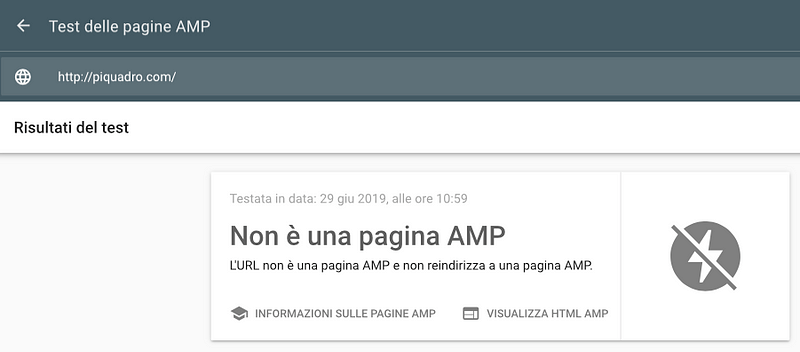
AMP Check
No pages were built with AMP technology. Here’s a screenshot representing the test run on Google tool for the homepage.
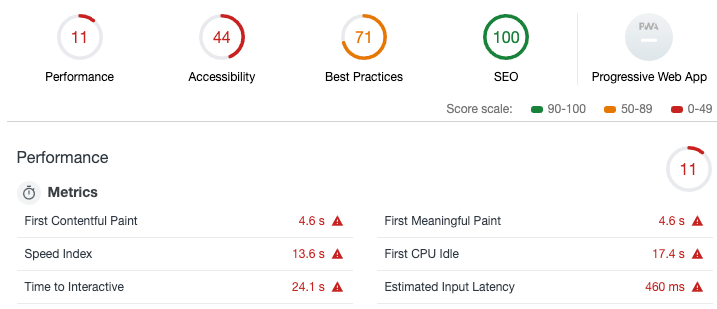
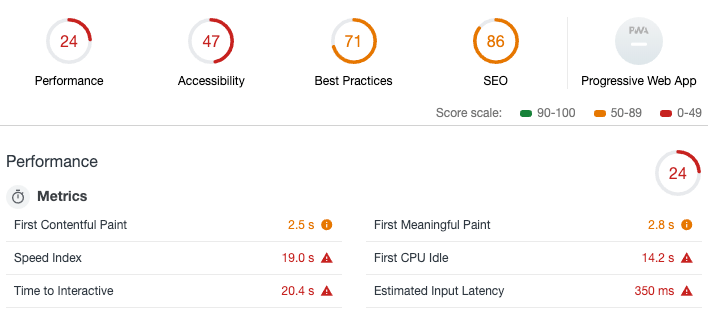
PWA Check
This performance audit shows the main gaps for page load speed time.
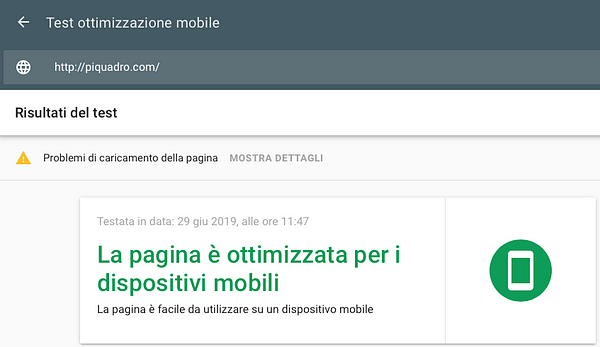
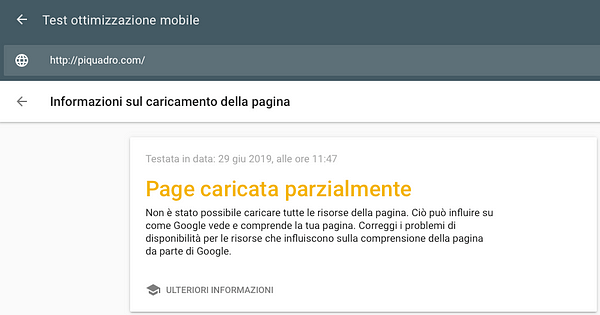
Mobile optimizations Check
Though the check is passed, not all scripts and images are being loaded in the right way from mobile devices. Indeed if you run the test on your own, by clicking the link above the screenshot, you can see what are the files not loaded that causes some problems during user navigation with a higher bounce rate consequently.
What if page load will increase?
You need to consider these metrics in the following, to understand how to hypothesize the profit loss monthly:
- Average Conversion Rate: 1.0% (in the retail industry the average CR is 1.7% according to Smart Insight report on 250 million sessions)
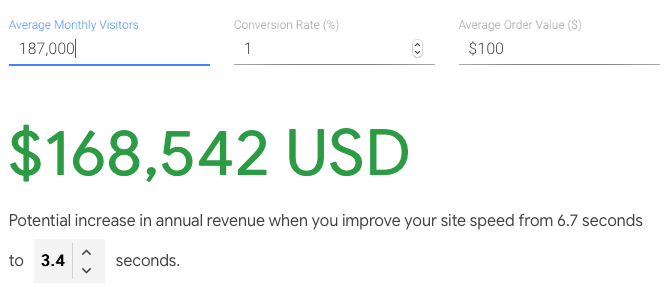
If page load time decrease at 3,4 seconds, it could earn this amount, considering that actually, it’s leaving it to competitors.
If you consider the fact that AOV and CR increase, leaving stable the actual page load time (6,7 seconds) the total forecast amount will increase drastically.
– ONLY IN ITALY PER MONTH
1.2 Case Study: Harmont & Blaine

AMP Check
No pages were built with AMP technology, here there’s a screenshot representing the test run on Google tool for the homepage.

PWA Check
This performance audit shows the main gaps for page load speed time.
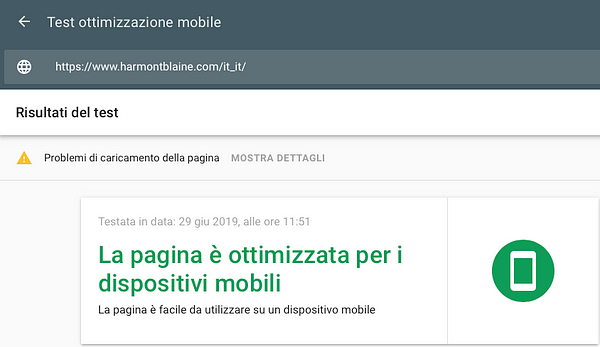
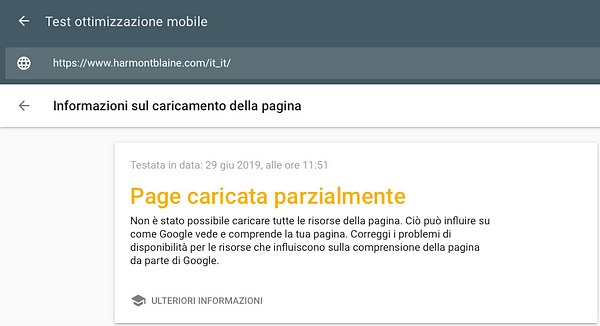
Mobile optimizations Check
Though the check is passed, in the detail page you can see what are the missing files, as said before for the Piquadro case study.
What if page load will increase?
You need to consider these metrics in the following, to understand how to hypothesize the profit loss monthly:
- Average Monthly Visitors — Italy: 90K (it’s 75% of total traffic)
- Average Conversion Rate: 1.0% (in the retail industry the average CR is 1.7% according to Smart Insight report on 250 million sessions)
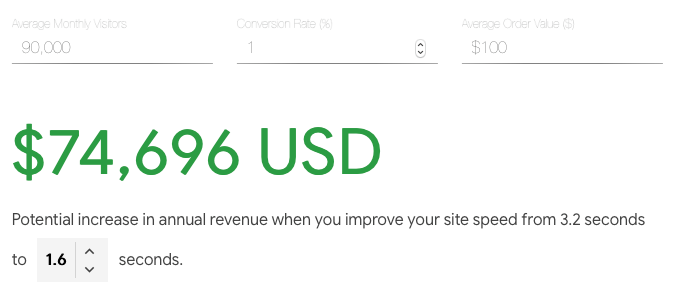
This brand is working pretty well on performance instead of others examined in this story and it can even reach 1.6 seconds in terms of page load speed with the right compressions.
If page load time decrease at 1,6 seconds, it could earn this amount, considering that actually, it’s leaving it to competitors.
If you consider the fact that AOV and CR increase, leaving stable the actual page load time (3,2 seconds) the total forecast amount will increase drastically.
– ONLY IN ITALY PER MONTH
How to fix them
- Images optimization: Kraken.io and JPEGmini are one of the most effective tools to do it. Moreover, consider using WebP image format;
- GZip compression. GZip can reduce file sizes up to 10 times.
- Consider the tips on Google Test My Site
2. Search bar
It represents the shortest path, for a user, to find something and it’s generally used when he doesn’t find what he’s looking for in the menu or during his shopping on the eCommerce.

Industry stats – In the following metrics you’ll find some common data in the retail industry, in pills:
- 80% of consumers will abandon a site after a poor search experience;
- Prospects convert at least 4x more than those who don’t use search functions;
- Users who complete a search are 1.8x (80%) more likely to convert;
- eConsultancy talks about cases where site search visitors are making up as much as 13.8% of the overall revenue.
The 4 top common pain points:
- Search bar not expanded;
- Absence of UX guidelines about live search;
- Results page without filters and there’s no coherence with user search and discovery intents. Sometimes I found no coherence with the keywords at all;
- Absolute absence of misspelling corrections.
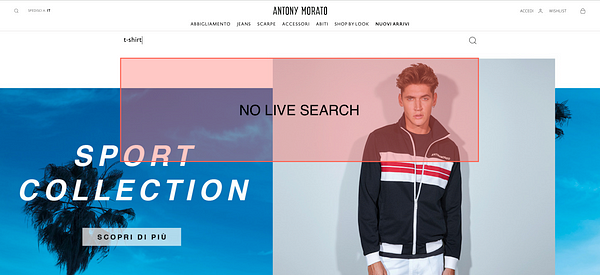
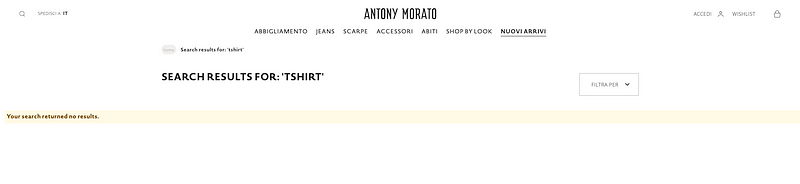
2.1 Case Study: Antony Morato

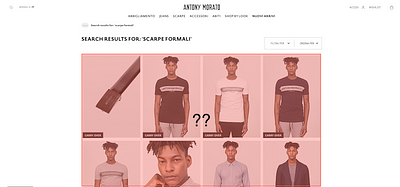
How much money, potentially are they losing yet?
To calculate an average gross profit loss, based on some metrics available online, I’m assuming that:
- Average Monthly Sessions — Total: 130K
- Average Conversion Rate: 1.0% (in the retail industry the average CR is 1.7% according to Smart Insight report on 250 million sessions)
- Average on-site search conversion rate: 2.0% (according to eConsultancy stats)
- CTR on search icon: 0.7% (hypothesis)
- Average Order Value: 100€ (hypothesis)
Monthly revenue from actual search: 18.900 €
Considering to edit ONLY search bar in an expanded version, without the live search, misspelling corrections and some other machine learning features, the average click it could be: 1.2% at least.
Monthly revenue from new search expanded: 31.200€
It increases the profit loss if the CTR on icon-search is lower and AOV and CR is higher.
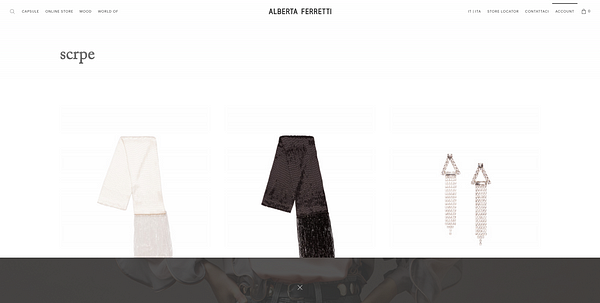
2.2 Case Study: Alberta Ferretti


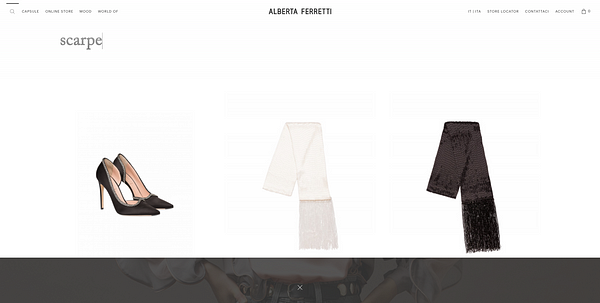
How much money, potentially are they losing yet?
To calculate an average gross profit loss, based on some metrics available online, I’m assuming that:
- Average Monthly Sessions — Total: 83K
- Average Conversion Rate: 1.0% (in the retail industry the average CR is 1,7% according to Smart Insight report on 250 million sessions)
- Average On-site search Conversion Rate: 2.0% (according to eConsultancy stats)
- CTR on search icon: 0.7% (hypothesis)
- Average Order Value: 230€ (hypothesis)
Monthly revenue from actual search: 26.726 €
Considering to fix ONLY search bar expanded, without considering a correct live search, misspelling corrections and some other machine learning features, the average click it could be: 1.2% at least.
Monthly revenue from new search expanded: 45.816€
How to fix them
- Part of them, you could fix using digital products that have live search, misspelling corrections and some other features in their core
- CRO activities based on A/B testing to get qualitative and quantitative insights to correct the issues
- UX best practice could be interesting if sometimes can be followed as starting points :)
- Do User Research!
Extra Info — Predictions by 2021
It’s predicted that early adopter brands that redesign their websites to support visual and voice search will increase digital commerce revenue by 30% — Gartner