

Understanding customer behavior is critical for businesses, especially in e-commerce and subscription-based models. One key metric that provides valuable insights into customer purchasing habits is the average time between orders (ATBO).
This metric helps you identify how often your customers make repeat purchases, allowing you to improve inventory management, marketing strategies, and customer retention plans.
What is the Average Time Between Orders?
The average time between orders (ATBO) is the average number of days between consecutive purchases made by a customer over a specified period. This metric is crucial for understanding purchasing patterns, predicting future orders, and identifying opportunities to optimize customer engagement.
Why is Calculating ATBO Important?
Calculating the ATBO provides several benefits for businesses:
- Predicting Future Sales: By knowing how often customers typically make repeat purchases, you can forecast future revenue and plan your inventory accordingly.
- Segmenting Customers: Customers who buy frequently versus those who have longer gaps between orders can be segmented for targeted marketing. For example, customers with shorter ATBOs can be offered loyalty rewards, while those with longer ATBOs might need re-engagement campaigns.
- Optimizing Marketing Strategies: Understanding the timing of repeat purchases helps in sending well-timed promotional emails or reminders, enhancing customer experience and driving more sales.
- Improving Customer Retention: Analyzing the ATBO can help identify customers who might be at risk of churning, enabling you to take proactive steps to re-engage them.
How to Calculate Average Time Between Orders
Calculating the ATBO involves a few steps. Below is a detailed approach:
1. Gather Your Data
The first step is to collect data on customer orders. The essential data points you’ll need are:
- Customer ID: A unique identifier for each customer.
- Order Date: The date when each purchase was made.
2. Sort Orders by Customer and Date
Once you have the data, sort it by customer ID and order date. This ensures that you can track the sequence of orders for each customer.
3. Calculate the Time Differences Between Orders
For each customer, calculate the number of days between consecutive orders. This is done by subtracting the previous order date from the current order date.
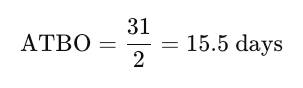
Example:If a customer placed orders on:
- January 1, 2024
- January 15, 2024
- February 1, 2024
The time gaps would be:
- 14 days between January 1 and January 15
- 17 days between January 15 and February 1
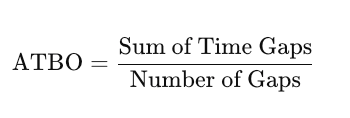
4. Calculate the Average Time Between Orders
To find the ATBO, take the sum of all time gaps between orders for a customer and divide it by the number of gaps.
Formula:
In the example above:
- Total time gaps = 14 + 17 = 31 days
- Number of gaps = 2
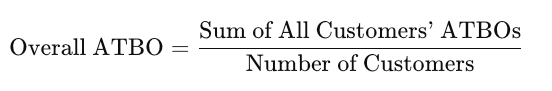
5. Calculate the Average Across All Customers
To get the overall ATBO for your entire customer base, repeat the steps above for each customer and then calculate the average of all individual ATBOs.
Tools to Automate ATBO Calculation
Manually calculating ATBO can be time-consuming, especially if you have a large customer base. Fortunately, some tools can help automate this process:
- Excel or Google Sheets: You can use formulas like
DATEDIFto calculate time differences and use pivot tables for analysis. - Customer Data Platforms (CDPs): Tools like Segment, HubSpot, and Salesforce can track order data and automatically calculate metrics like ATBO.
- SQL Databases: Using SQL queries to calculate time differences and averages can be highly effective for more complex datasets.

Best Practices for Using ATBO Data
Once you have calculated the ATBO, you can leverage the insights in several ways:
- Trigger-Based Marketing: Set up automated emails or SMS campaigns to re-engage customers based on their typical ATBO. For example, if a customer usually orders every 20 days, you can send a reminder around day 18.
- Customer Segmentation: Segment customers based on their ATBO. Frequent buyers can be offered loyalty programs, while those with longer gaps may need incentives like discounts to encourage repeat purchases.
- Inventory Management: Use ATBO to optimize stock levels, ensuring sufficient inventory to meet demand during peak purchasing periods.
- Churn Prediction: If a customer’s ATBO starts increasing, it could indicate a churn risk. Proactively reach out to these customers with personalized offers or engagement campaigns.
Real-World Example: Subscription Box Business
Consider a subscription box business offering monthly deliveries. The ATBO would ideally be around 30 days. If the ATBO for some customers extends beyond this, it may indicate dissatisfaction or a decline in engagement. The business can then send targeted offers or reminders to keep these customers on track.
Final thoughts
Calculating the average time between orders is a straightforward yet powerful way to gain insights into customer purchasing behavior. Understanding how frequently your customers buy from you can create more effective marketing strategies, improve retention, and optimize operations.
Whether running a small e-commerce store or managing a large enterprise, ATBO is a metric worth tracking to drive sustainable growth.