 Alex Genovese
What is customer segmentation analysis? How can I do that?
Data collected by Google Analytics is a good starting point, but there are many other tools to be able to get more useful information for internal analysis (customer base) and for anonymous users (guests).
Here are some of the most important KPIs regarding classification algorithms and usually used in Business Intelligence in order to understand the relevance of the segments in terms of breadth and value.
In this way it's possible to create different groups with different peculiarities depending on the defined metrics. Of course, there are ready-made algorithms and cluster definitions, one above all the RFM algorithm.
What is RFM Analysis? – Learn more by reading this article
Below I grouped the main KPIs related to customer behaviours which are generally mapped for creating several types of customer clusters.
Purchasing Customer Metrics
Buying behaviour clearly defines everything that concerns a customer's direct preferences, which are the real expression of what customers will.
- Order average value
- The date of their first purchase
- LTV – The total revenue value of their purchases
- Number of orders they’ve placed
- Items they’ve purchased
- Average time their last order
Navigation Customer Metrics
All that concerns before purchasing interests, that is indirect preferences, are mapped in the following bullet points.
- Time since it's interacted with the last content or product
- Products they viewed more than once
- Average frequency (average order in a span time range)
- The average time they spent in a specific category or in a product page
- Bounce Rate Average
- Number of pages per session
Demographic Customer Analytics
The metrics and demographic dimensions are used to understand the composition of the segments, inherent to direct and indirect preferences. What are their locations?
- Locations (city, nations, regions, etc.)
- Direct interests
- Category affinity interests
- Age ranges
How does RFM analysis help segment and convert customers better?
By creating a segmentation based on direct preferences it's possible to identify certain behaviours of our customers, identifying:
- everything our customer base likes and dislikes
- how many times in a year do they purchase the same product
- how their shopping cart is composed
This information allows us to take an important step forward: anticipating the will of customers and driving them to an unexpressed behaviour providing them with the right contents or products.
Furthermore, using machine learning it is possible to make predictions regarding the probability of the next purchase or recreate a new segmentation using more interesting algorithms such as that of K-Means.
The RFM algorithm makes us able to group into 11 clusters (mutually exclusive groupings), avoiding overlaps and analyzing the expression of direct customer preferences: Recency, Frequency and Monetary.

What is RFM used for?
This algorithm is used to both acquire new customers and retain existing ones.
Internal and external analysis questions can be answered:
- Internal Analysis: answers all questions regarding retention and nurturing activities;
- External Analysis: it concerns exclusively the strategies and tactics for acquiring new customers.
INTERNAL ANALYSIS
What are the customer clusters that drive my revenues?
They are represented by those groups that repeatedly buy (frequency), which make up a higher average order value (compared to the others) and with higher quantities as possible.
In these clusters, retention strategies are applied to continue to maintain continuous and active contact.
What do the most loyal customers buy?
The answer is to be found in the groups of customers who basically have an average purchase frequency onwards and sorting by the number of times purchased for each item in descending order.
Which customers are about to leave? How much are they worth in terms of turnover?
They are represented by groups that are generally defined as "Can't Lose Them": they no longer expressed direct preferences (purchase) compared to those that are to be considered active.
PRO TIPS: creating a "drill-down" on a navigation dimension (indirect preferences) it is possible to understand if a customer is not buying for a specific reason, which could be: new design and difficulty in purchasing, new merchandising not in line with his preferences, etc.
EXTERNAL ANALYSIS
How is it possible to acquire customers who are more likely to be interested in my products?
By ordering the quantity purchased for each single SKU in descending order, and using a dimension that acts as a data layer - RFM analysis - it is possible to understand which type of cluster prefers which products.
Using the best clusters, lookalike audiences are created in order to acquire new customers by exploiting the artificial intelligence and algorithms of Big G and Facebook. These algorithms allow you to create an audience similar to that sent via a CSV file, where information such as name, surname, LTV (Lifetime Value) and email are present.
In this way, we are instructing the marketing platform to provide us with an audience that is relevant to what we have imported.
How to acquire customers who buy more frequently?
Often it is necessary to acquire customers who have a higher purchase frequency than the norm, while not driving the turnover, they are important for other reasons of turnover traction.
The segmentation performed by RFM can be represented in many other ways, allowing a more detailed analysis.
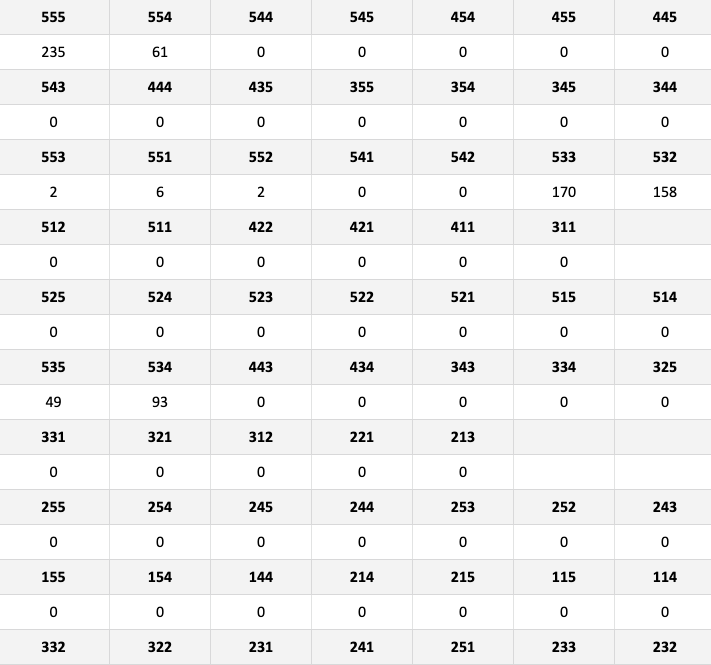
By counting the number of customers present in every single triple (represents the scores relating to Recency, Frequency and Monetary), we can define much more detailed purchasing behaviours and groups for those that are more in line with our needs.
PRO TIPS – Using simple combinations (combinatorics) we can efficiently show content or products to each group of customers who have similar behaviour to evaluate their effectiveness.