

A few months ago I launched a retention strategy and created a post analysis after some month from launch about the uplift of retention rate.
 Alex Genovese
Challenge
Increase sales through a retention strategy
The project concerned an essential aspect that is mostly typical of growing e-commerces that reach a constant turnover over time, struggling to acquire new market shares and customers.
His marketing team was struggled and focussed on marketing campaigns performance and ROAS to try to uplift increasing revenue over time.
Mostly of the time not pay attention to the data acquired and they not consider the customer base signals to solve the problem because I think that the power of retention is underestimated :)
No, for real, is always understimated the data power and the correct reading.
Solution
Learn from data all possible pathways
Analyzing the available data, I found that a problematic index was the frequency of communications after the purchase journey – the main sales process was mostly the same and repeated month over the month, it can be represented in the following 4 steps:
- Acquisition by Ads Channel
- Landing on dedicated offer page or product page
- Cart page
- Checkout
To sale a product, the only effective tactics they roll out was acquiring new customers and land them on the specific page. All comes around the acquisition costs, and nothing about retention – sending newsletter to all customer base it's not a retention strategy at all.
Identifying the reasons
In this case, the customer, once the product is out of stock, prefers to buy it back (assuming a parity of "performance" with respect to competitors) from the competition. This was crystal clear analyzing the cohorts and enlighted in evidence of a substantial number in the About to Sleep, Lost and Need Attention segments.
The reasons why they didn't choose again the same product could be the most various (it concerns the price/quality tread off, the product quality, a competitor's offer, etc.) and in almost all market segments it's considering the customer is never too loyal.
The main questions I asked myself to better understand how to orient the strategy were:
- Are all product values properly communicated?
- Does the customer perceive the communicated values?
- Does communication is constant in the customer journey while he's consuming the product?
In order to answer these questions, I studied what was currently being communicated and it was of little relevance to the final consumer.
I used cohort analyzes to then implement a contact strategy that increases in frequency near the "buy back".
Cohort Analysis
Visualize behaviors over time
This analysis makes it possible to separate groups of users related by similar behavior or business metrics, producing very heterogeneous segments with socio-demographic, psychographic and behavioral profiles very distant from each other.
Using a time dimension we can clearly visualize buy back times or loyalty and therefore understand if there is a repeated behavior over time that we can learn and use to improve customer experience and business kpi.
Cohort analysis allows us to identify behavioral patterns in a more defined way, within the life cycle of a user.
Using different visualization metrics in Google Analytics (Audience / Cohort Analysis) it's possible to read the average increase or decrease of behavioral navigation and retention.
The following representation shows the trend of loyalty over the different weeks compared to the acquisition day using a custom segment "Have made a purchase".
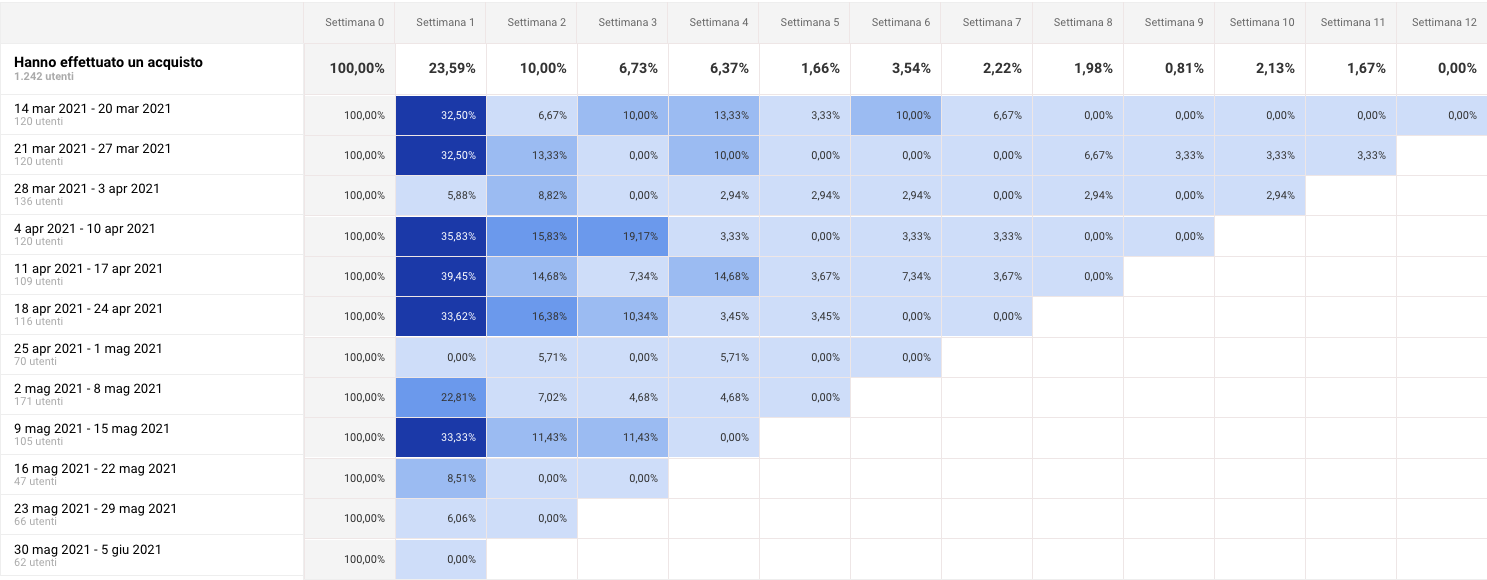
In SaaS products, this analysis is much more complex and informative, as the cohort analysis of loyalty is closely related to business performance. In e-commerce, if there is no editorial section, it's thinner: the reason is very simple - there are no contents or valid reasons (except for the purchase) for which a user returns on this touchpoint.
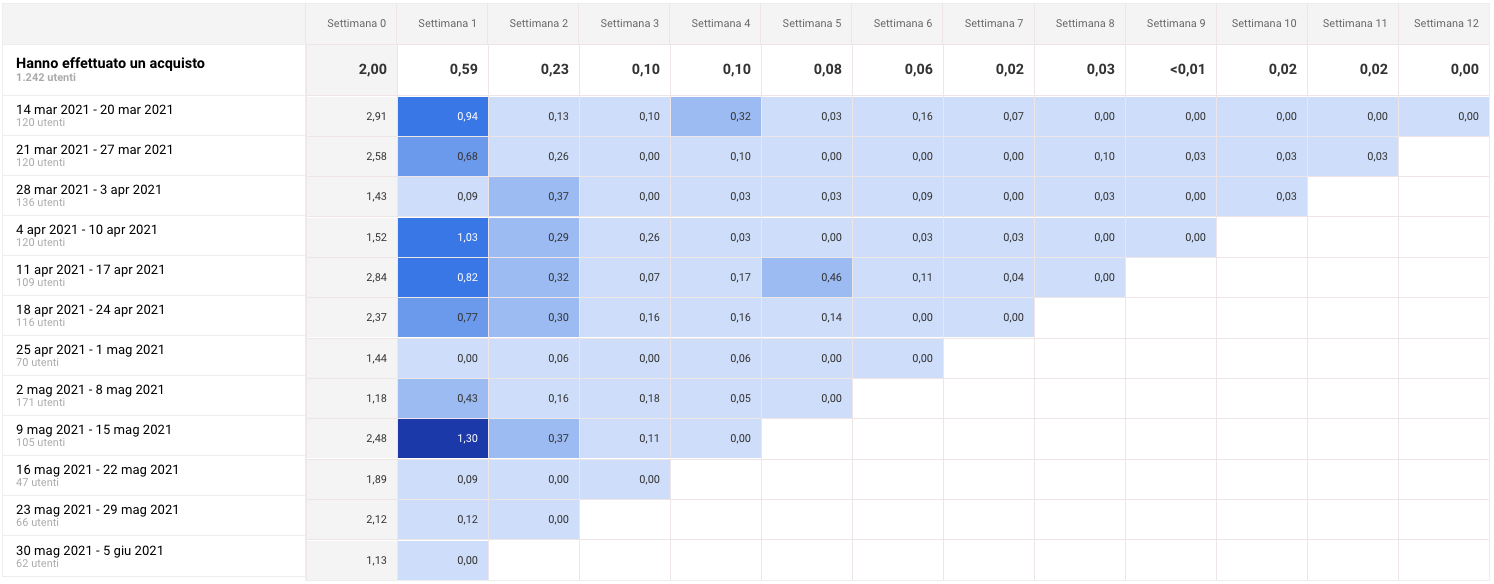
Indeed, the average sessions are low or absent in the 3rd or 4th week, except for a single week at the end of April 'cause was a national italian holiday, with particularly active promotions and campaigns.
After that, I exported all orders data within last 3 months and created a breakdown day by day with Purchased Product SKU> 1 per Customer (User ID).
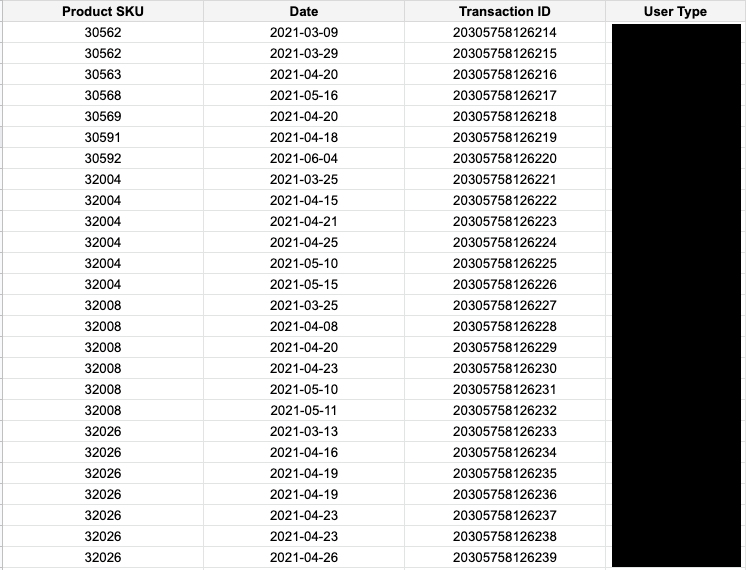
User Type – identify a unique customer through User ID.
The exported and normalized data have a similarity with those necessary for the creation of the RFM, but unlike these they further deepen each single order.
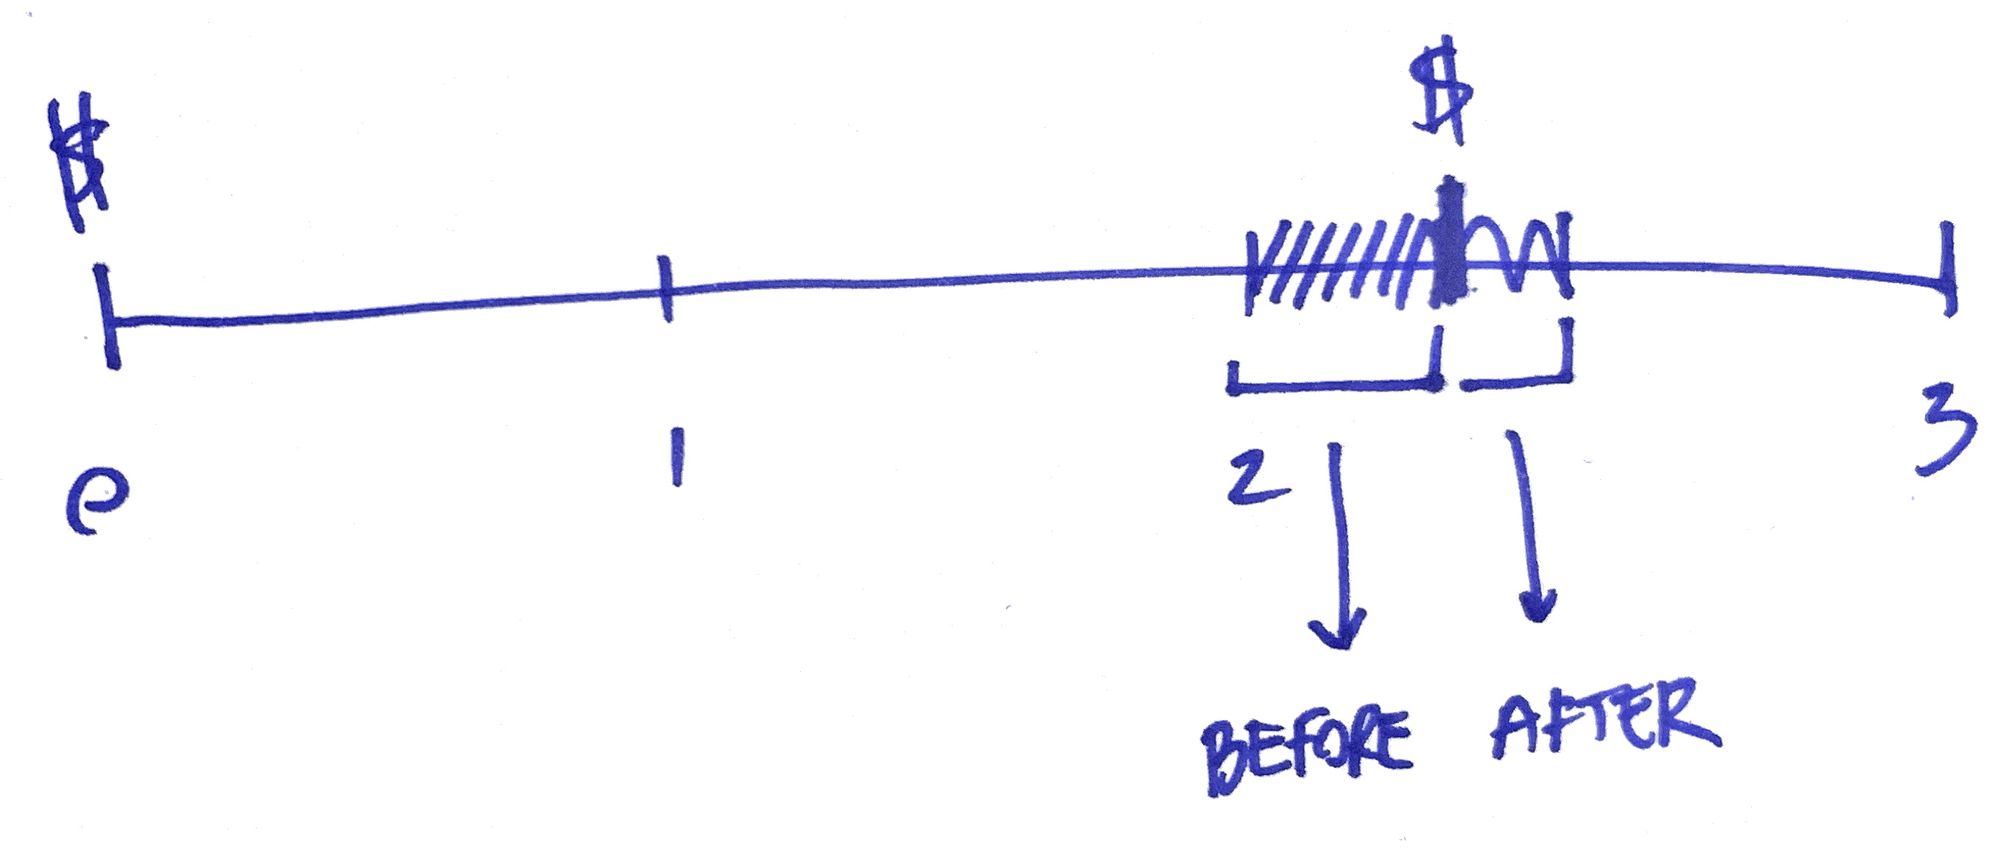
The timeline above shows the first purchase at T0 (week 0) and the second order placed at T2. The first block in evidence indicate the time in which to increase the communication frequency to the customers who have potentially out of stock the product:
- BEFORE: by increasing the frequency of communications, we will have a higher percentage of repurchases;
- AFTER: communication aimed at collecting useful information for the NPS (Net Promoter Score) to collect what went wrong.
Through a NxM matrix, I created A/B testing to identify even the best frequency and time to communicate with customers. In this way, I identified the highest percentage of success probability.
Something like the following table:
| 3 mails | 2 mails | 1 mail | |
|---|---|---|---|
| 3 days | |||
| 2 days | |||
| 1 days | |||
Declining this analysis on a specific e-commerce category, it's possible to better fine tuning the uplift retention rate.
It's something I rolled out to increase revenues time over time through coming out with a successful strategy on buy back then the previous period.
Retention is determined by several elements, the main one is certainly the composition of the merchandising. A product that causes periodic repurchase is most likely subjected to constant consumption over time.
Accompanying the post-sales journey and correctly communicating product values is an excellent way to continue to maintain a valuable contact, increase the customer experience in order to then reach an almost spontaneous programmatic repurchase.
From theory to a practice example
How apply this strategy on a consumable product
Considering the use of a lipstick, used almost every day, its average consumption is on average in 4 months.
During this time range, it's necessary to keep in touch with customers, decreasing the frequency, taking advantage of the multi-channel support (Post, Push notifications, Email, etc.) with relevant content to the products purchased, advise on the correct use, obtain an attractive look for the evening or its correct storage. This could represent a viable way to continue to have a constant relationship with valuable content, increasing the customer experience and the value of the product.
Near the end of the consumption cycle, we capture the customer's attention increasing the communication frequency, using a dedicated coupon or a timed offer to push him to the purchasing stage increasing retention rate.