
 Alex Genovese
Only some people know that the correct interpretation and reading of analytical data can guide with less risk.
Extracting purchase history from the customer base, it’s possible to understand if there are recurring patterns, loyal customer segments or enough data for creating a deep data analysis on merchandising and preference to create new products for different uses (bundle, samples, etc.)
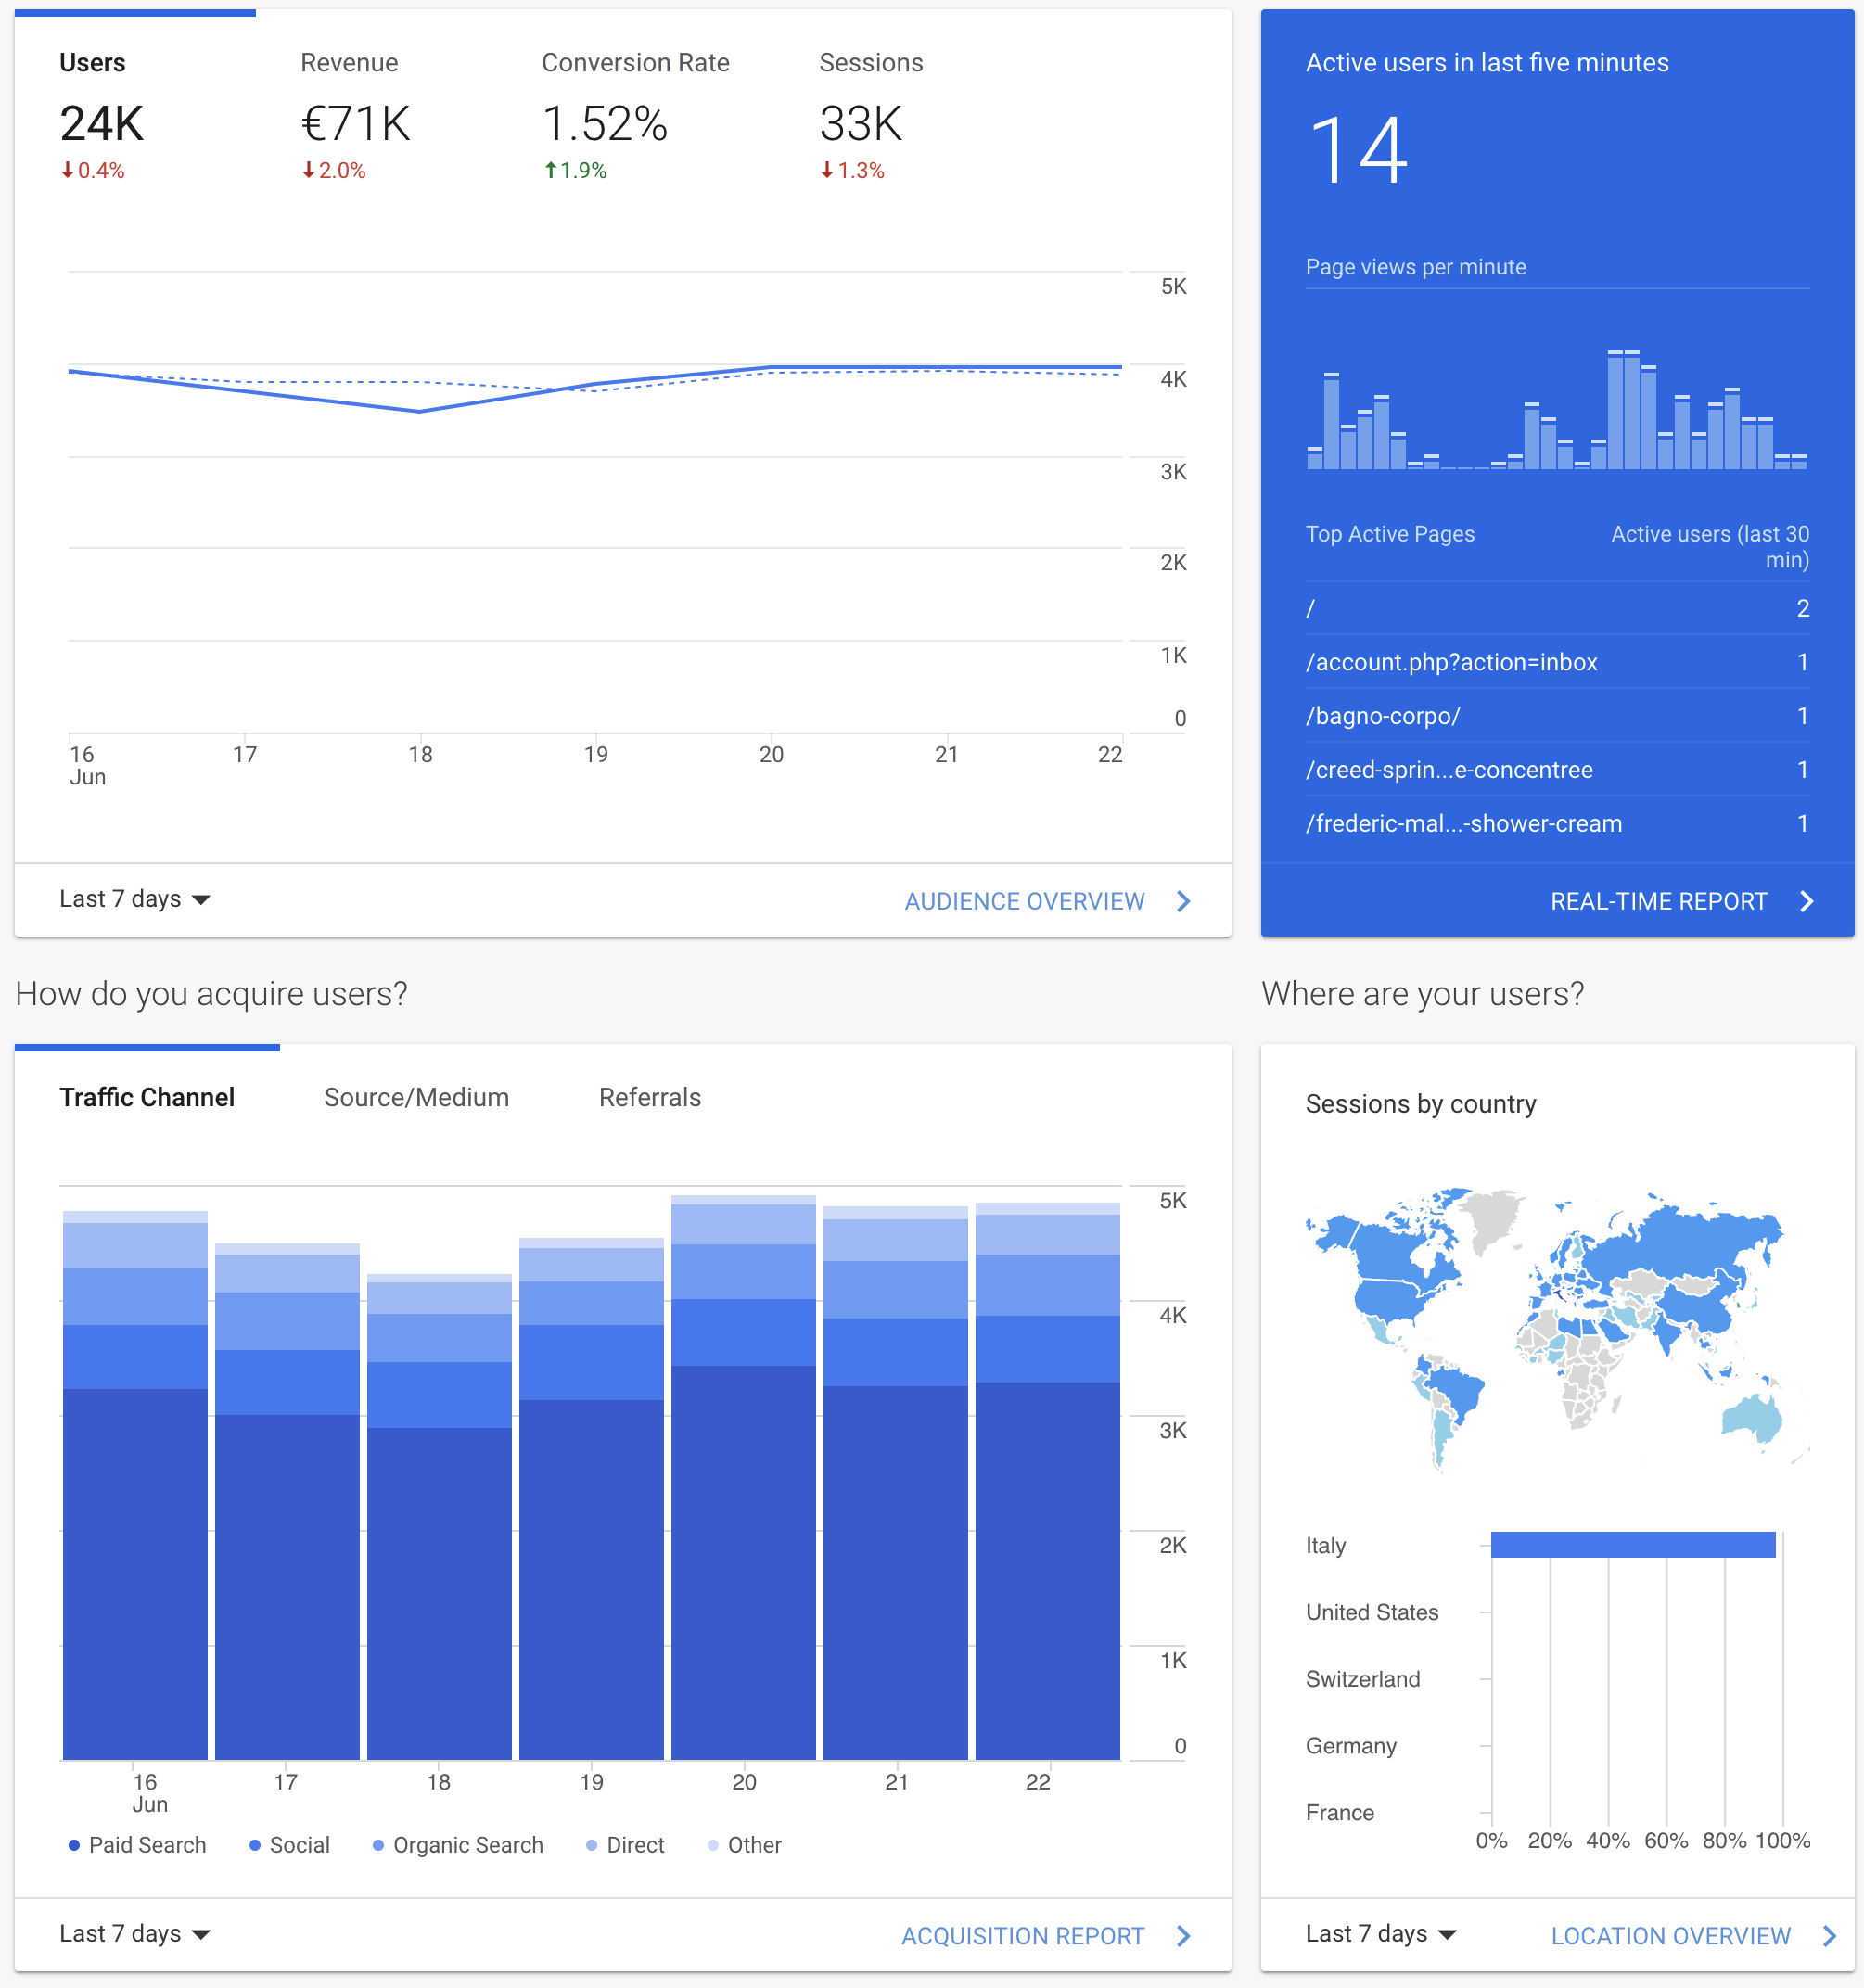
You can go deeper into your data by connecting multiple sources and viewing it on Business Intelligence, like Looker, Qlik, or Google Data Studio.
Alex Genovese
- What product is sold with a greater than 90% probability when associated with product X?
- How likely is my merchandising category to sell versus the segment that buys most of my long-time customers?
- What is the best combination of upsells for a specific segment? How do I sell high-margin products to an audience more interested in buying?
For e-commerce with sessions less than 150k per month, extracting interesting data and creating customer segments to share into Google Ads Management settings for use in different Google Ads campaign structures is still possible.
Most of the time, the remarketing campaigns are built following the suggestions shown in advertising platforms or according to general patterns like “up to 7 days from adding to the cart”, “up to 30 or 60 days from visiting the site”, etc.
If we look better Google Analytics, we have a section dedicated to the analysis of purchases where there are two sections which seem not to have a great value: Time Lag and Path Length, which could be implemented in the Google Ads Campaigns.
Time Lag
Time lag in Google Analytics tells you how many days your visitors take to complete the final conversion after their first interaction.
The path length report in Google Analytics shows how many times a user interacted on your site to complete a final conversion. Generally speaking, the path length report follows the trend of the time lag report.
The Time Lag report is thus nested into the Multi-Channel Funnel because it considers every channel in the conversion path for marketing attribution.
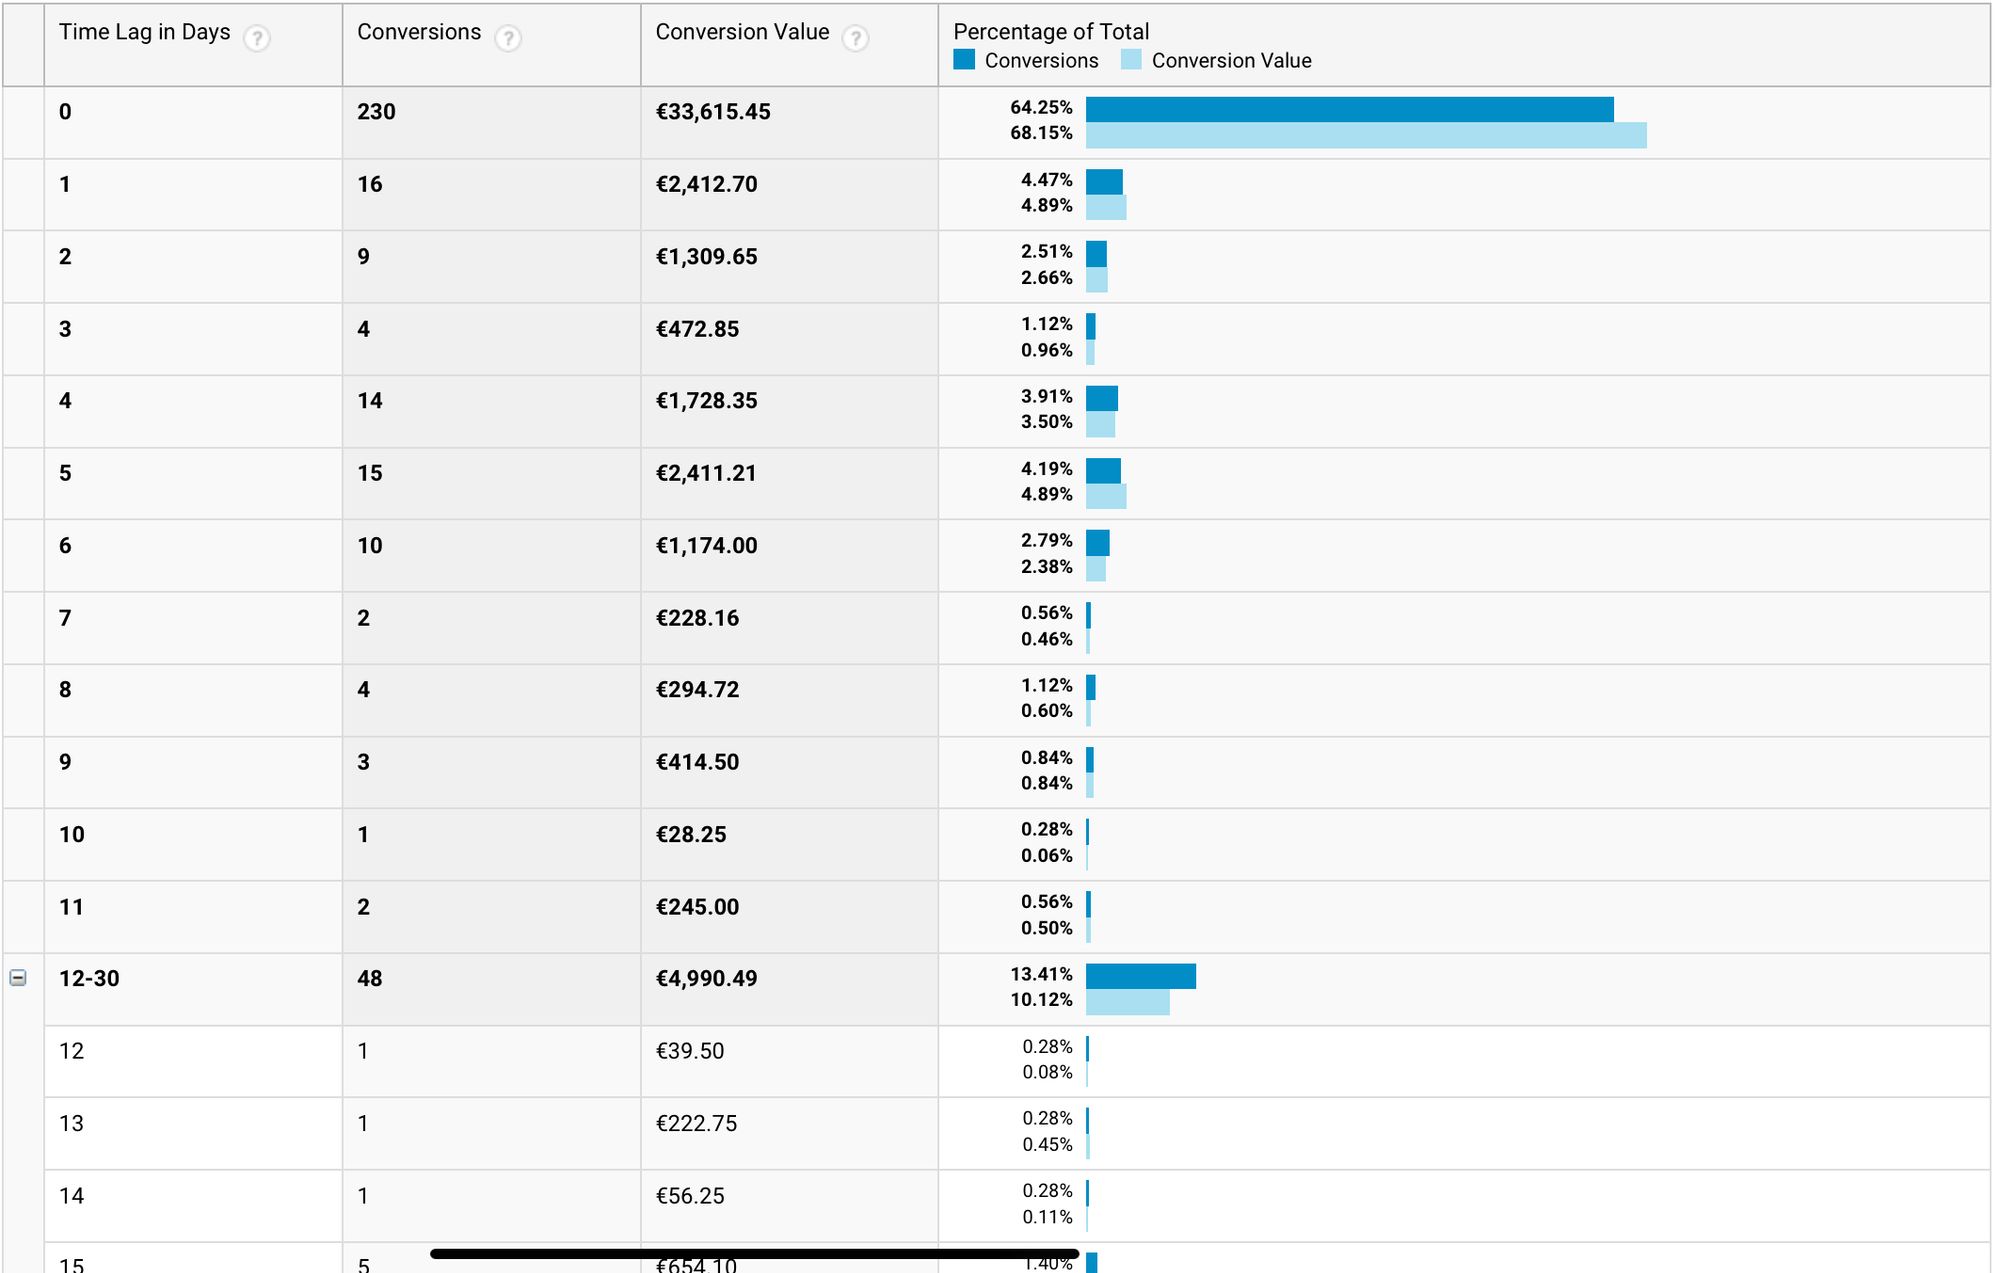
According to the above screenshot, it takes 12+ days for a little over 13.41% of customers to complete the final conversion. Since people have your brand on top of their minds even after two weeks from their first interaction, you can target those people by setting up a remarketing campaign and enticing them to complete the conversion sooner.
You can go deeper if you select the conversion type above and understand which performs better than the others.
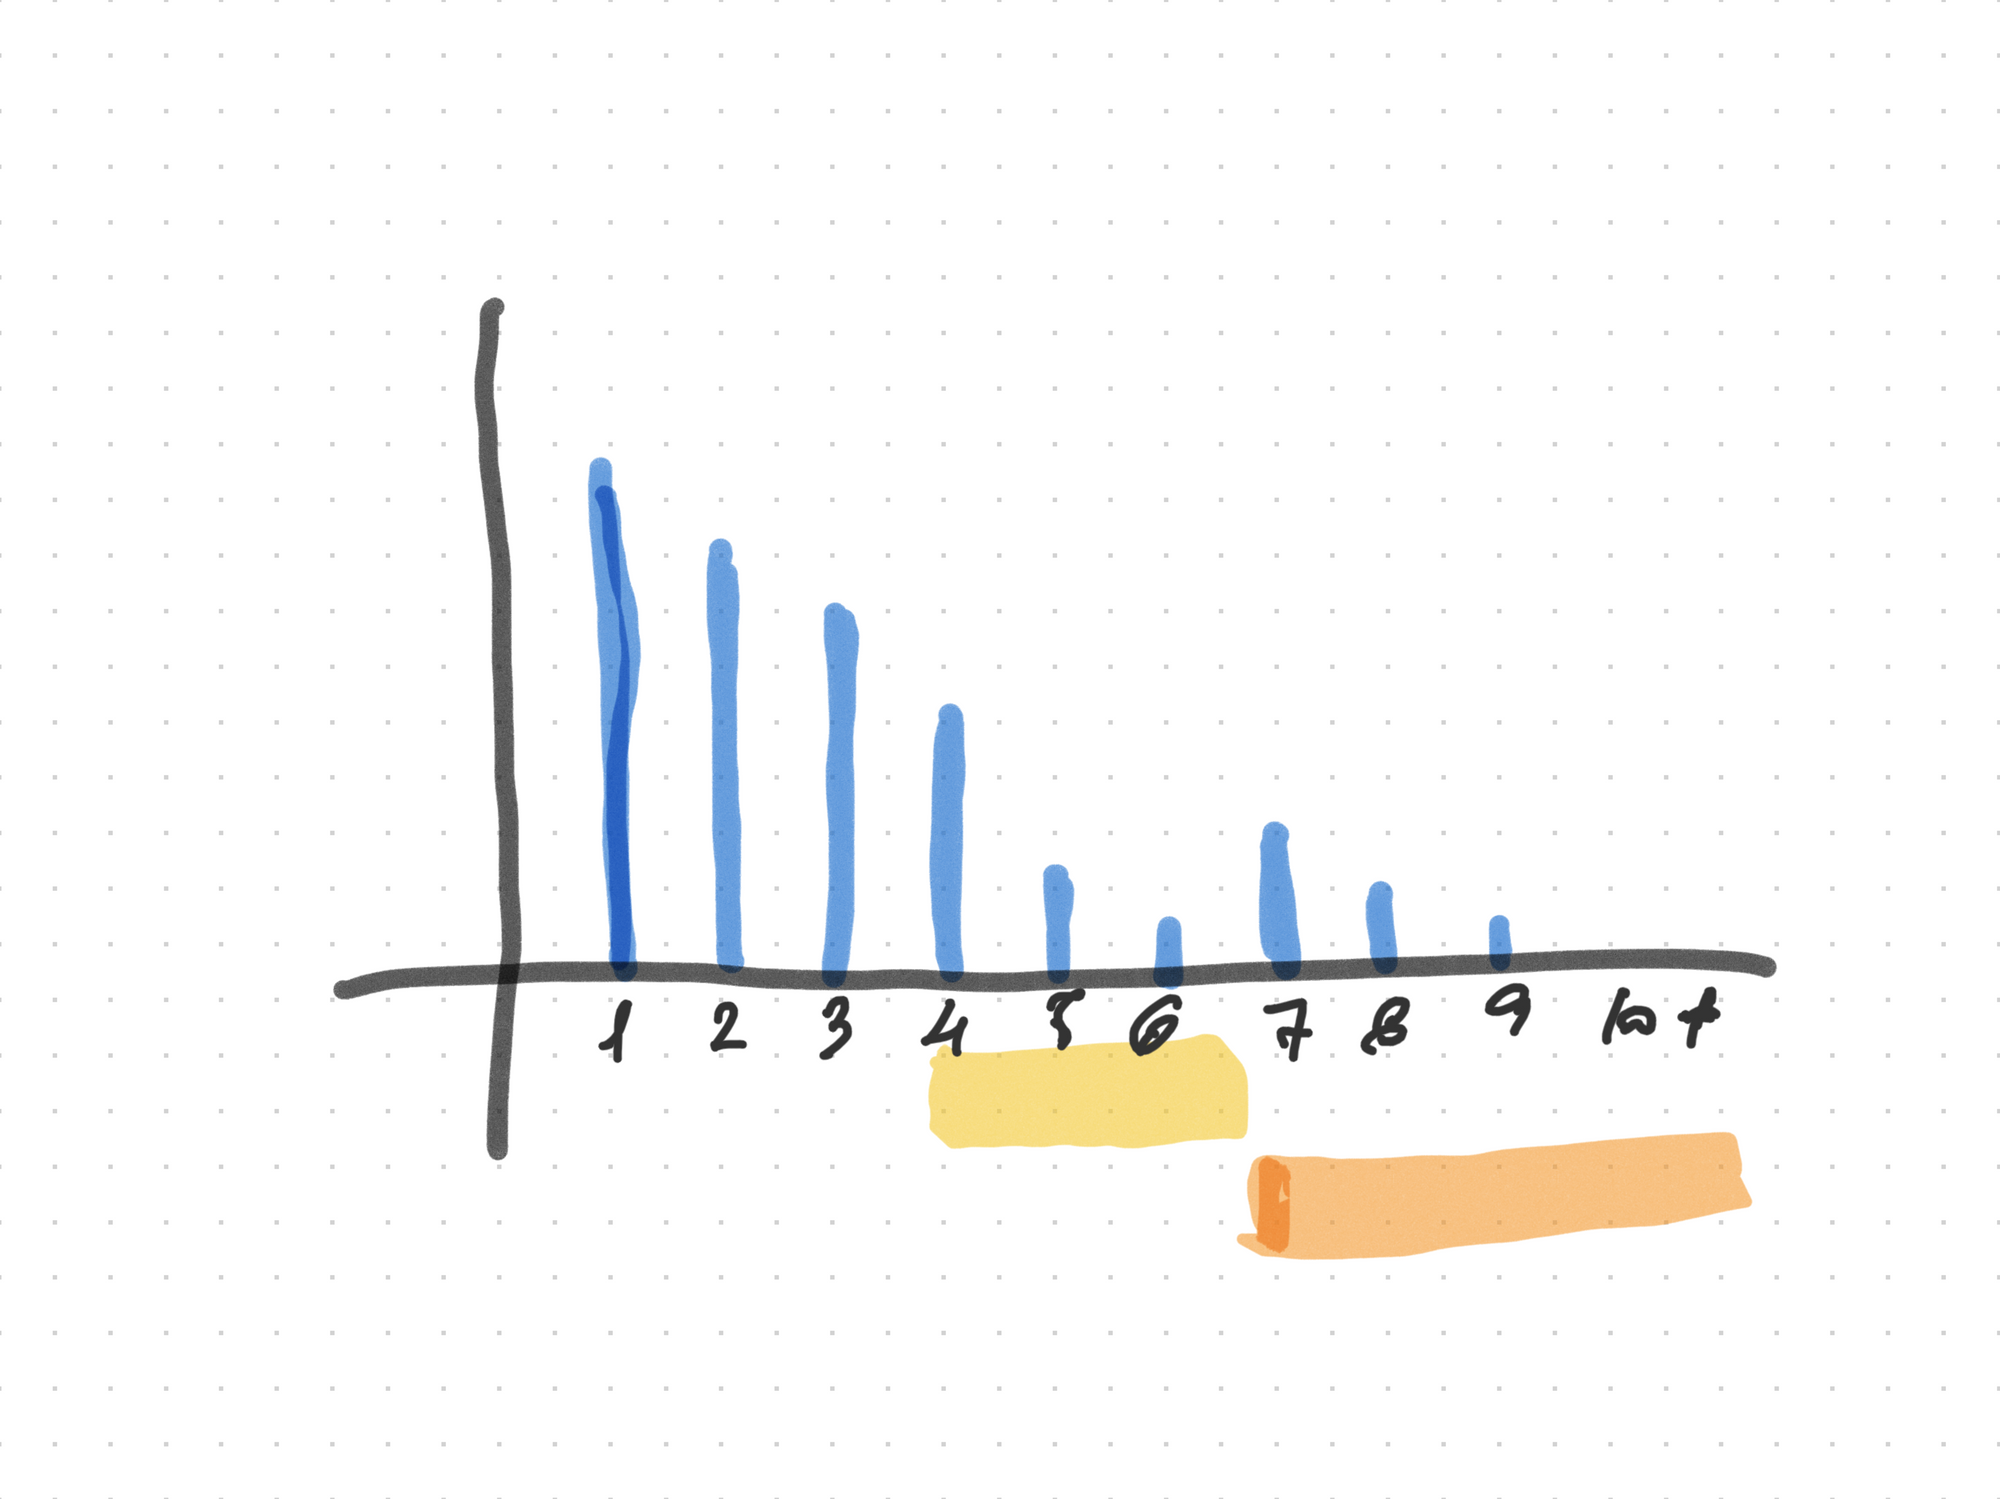
Path Length
It provides an overview of the touchpoints (clicks) it takes for users to complete a specific conversion on the website.
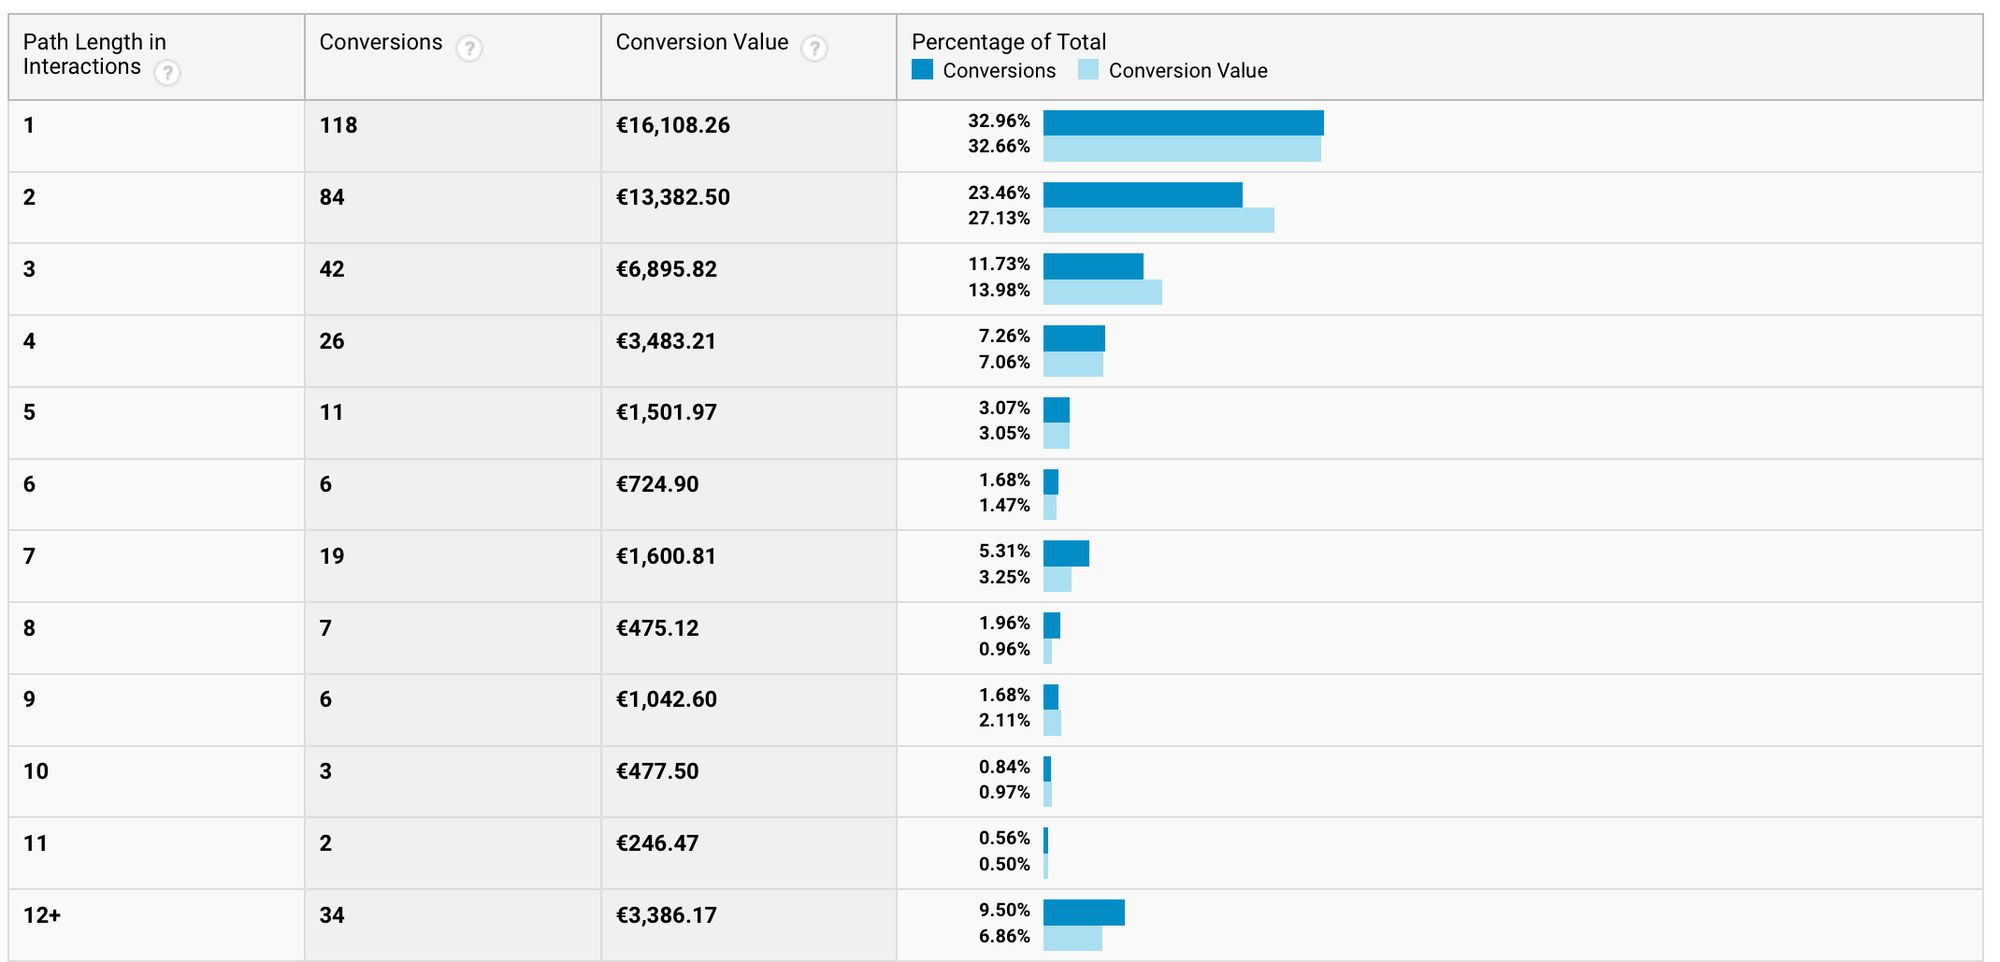
Watching the screenshot above, 79% on average of customers bought in the first three interactions for this specific conversion (purchase). Therefore, diving deep into data and breaking down the 2nd and 3rd days should be much more interesting, understanding the channels and their contribution along their journey.
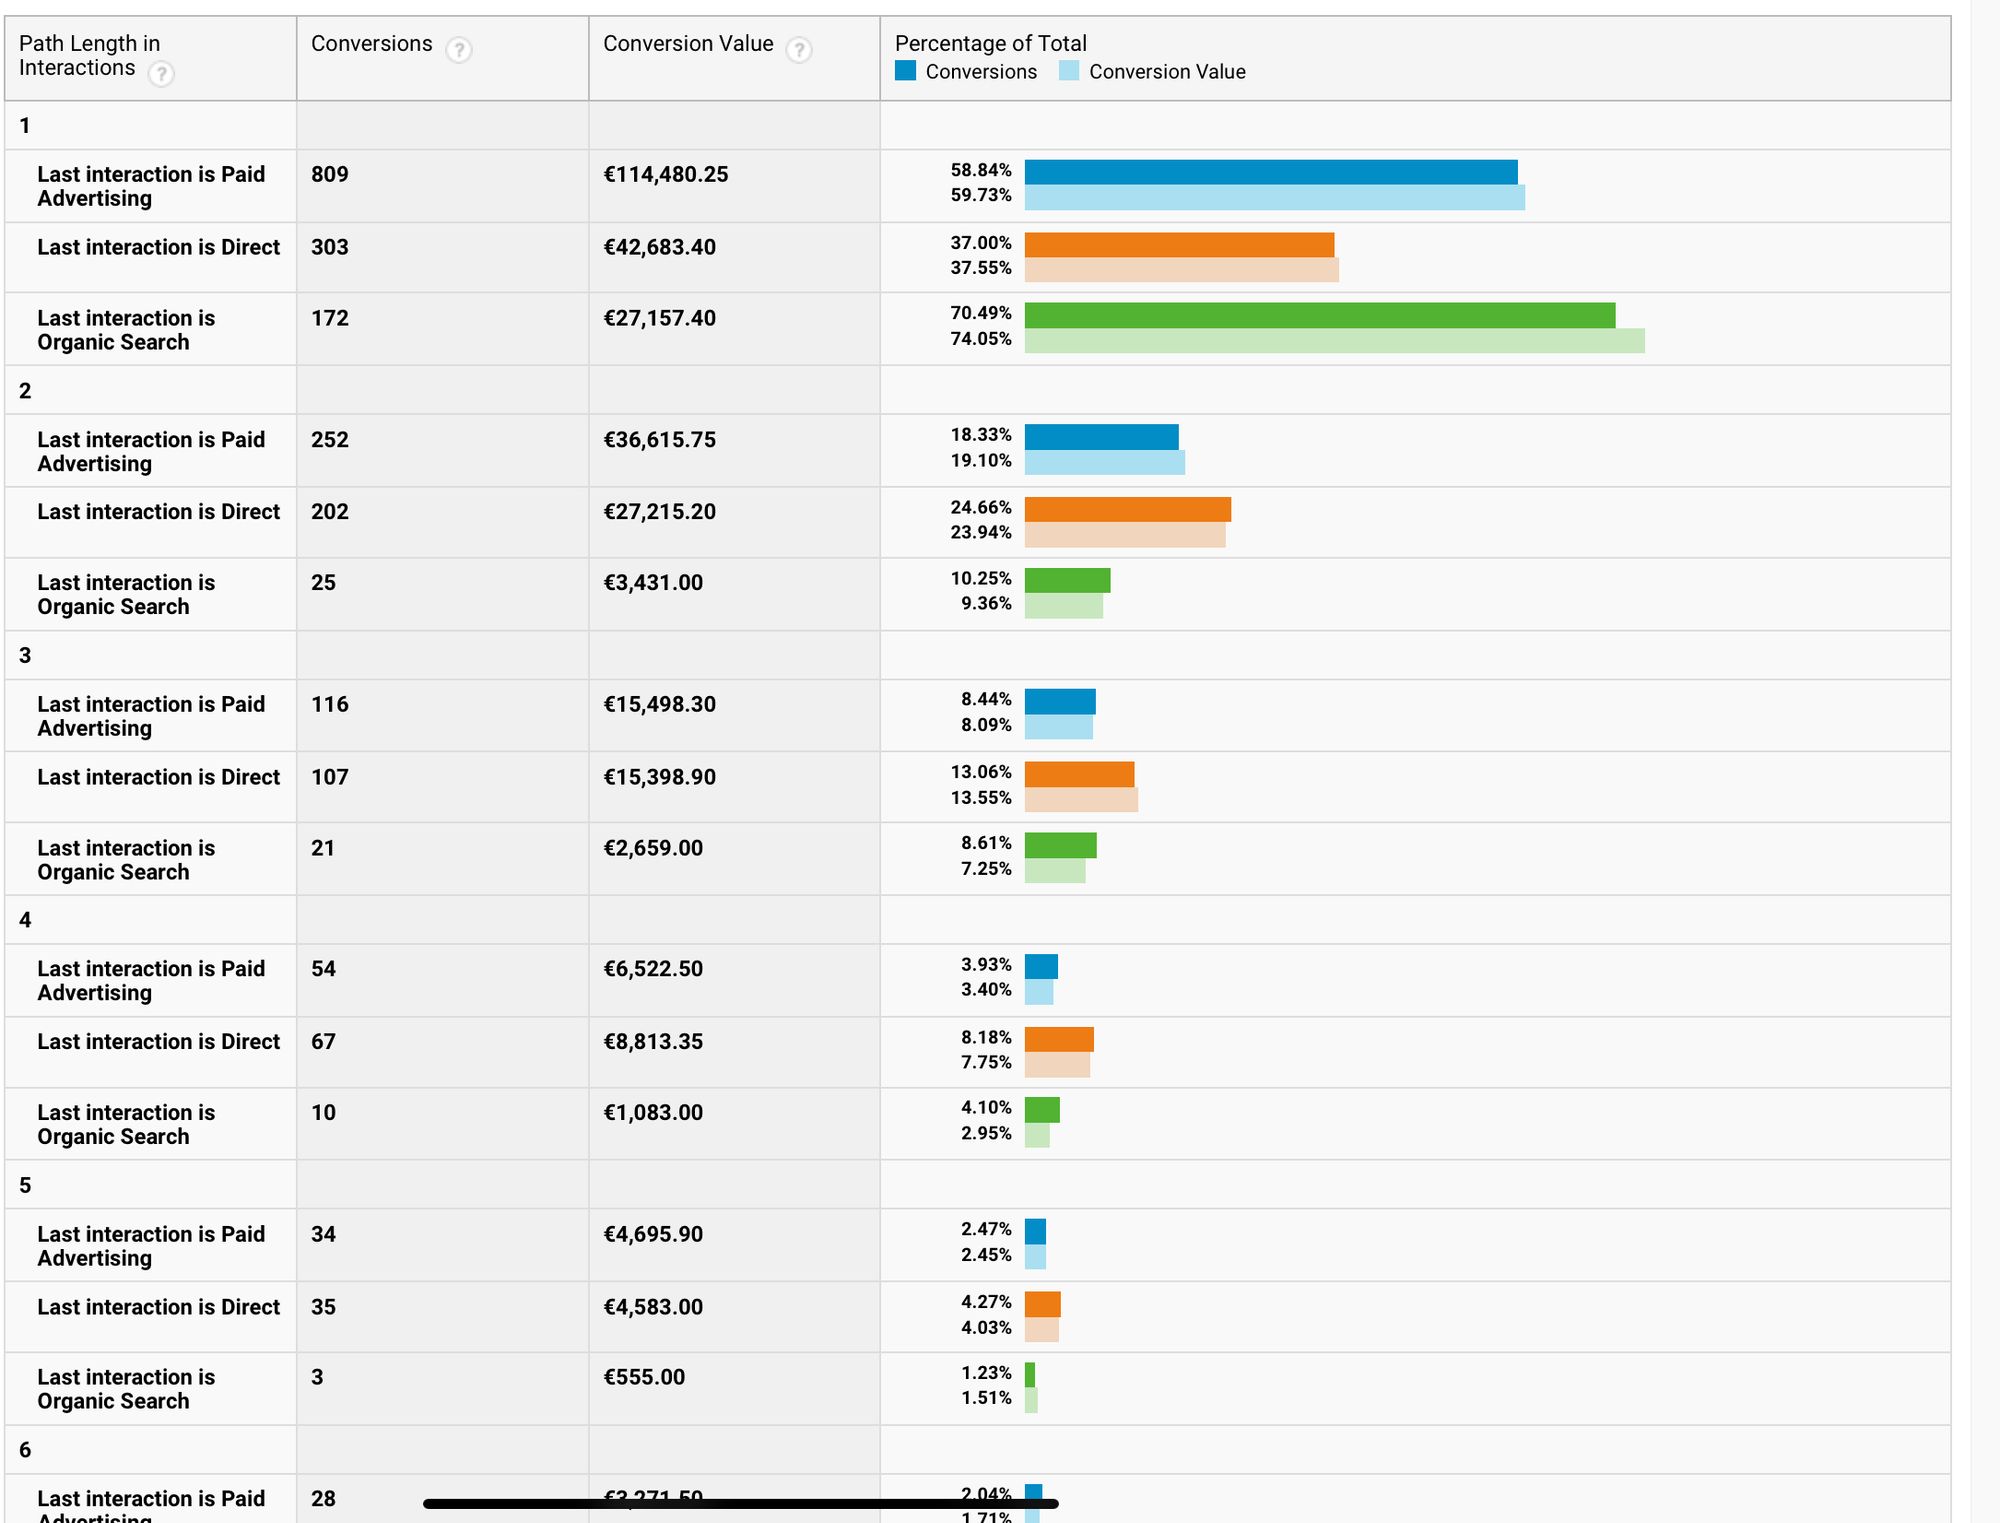
From the graph below, it is possible to evaluate how organic traffic gives a great deal in terms of the percentage of conversions but a low contribution as regards the number of the same and their value which turns out to be just over 1/4 of the Paid.
PRO TIP - These evaluations are done using a last-click attribution method; in Google Analytics 4 we can compare different attribution models, which could lead to other considerations.
There is a small peak on day 7th to retargeting campaigns that go to solicit interaction from day 6 onwards. However, a good part of the conversions also occurs from the 12th day ahead, when creating a specific retargeting campaign would be helpful.
Putting what you have learned into practice: creating a data-driven tactic
Considering the path length to understand which channels are converting the most in which time and setting up at least two retargeting campaigns from the 4th to the 6th day and the 7th until the 10th days for uplifting the conversion rate and sales.
We should "declinate" the two campaigns in three different channels: paid, organic and direct; we should roll out a strategy for each one and measure the impact on them weekly, as shown below:
The table below shows a matrix method to build retargeting campaigns divided by channel and promotional message.
| First Timeframe | Second Timeframe | |
| Organic | Promo #1 | Promo #1 |
| Direct | Promo #1 | Promo #1 |
| Paid | Promo #1 | Promo #1 |
| Organic | Products | Products |
| Direct | Products | Products |
| Paid | Products | Products |
PRO TIP: this matrix can be amplified by dividing it by customer clusters
Paid Channel
It's easy to create a simple retargeting campaign by considering the timeframe shown above and showing the most impactful communication you have in your Google Ads Campaign.
Direct Channel
For 90% of e-commerce, this is the most important channel because it has the highest profit margin. So increasing the conversion rate here by 1% most likely means taking home a nice extra margin.
Organic Channel
Again, the channel is among the most profitable, but there aren't many quick tactics to implement in this case.
Usually, you work by creating a medium to long-term organic positioning strategy using SEO and tracking performance every week or MoM.